the Performance Golden Rule
Yesterday I did a workshop at Google Ventures for some of their portfolio companies. I didn’t know how much performance background the audience would have, so I did an overview of everything performance-related starting with my first presentations back in 2007. It was very nostalgic. It has been years since I talked about the best practices from High Performance Web Sites. I reviewed some of those early tips, like Make Fewer HTTP Requests, Add an Expires Header, and Gzip Components.
But I needed to go back even further. Thinking back to before Velocity and WPO existed, I thought I might have to clarify why I focus mostly on frontend performance optimizations. I found my slides that explained the Performance Golden Rule:
80-90% of the end-user response time is spent on the frontend.
Start there.
There were some associated slides that showed the backend and frontend times for popular websites, but the data was old and limited, so I decided to update it. Here are the results.
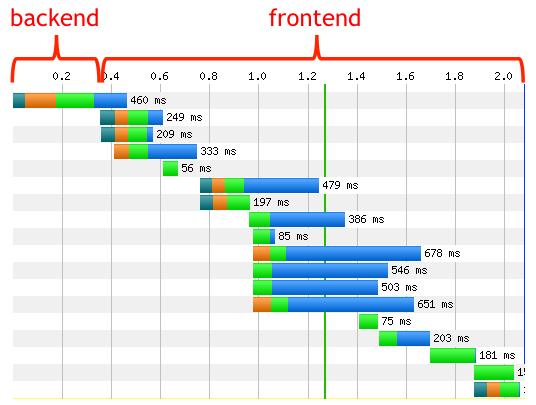
First is an example waterfall showing the backend/frontend split. This waterfall is for LinkedIn. The “backend” time is the time it takes the server to get the first byte back to the client. This typically includes the bulk of backend processing: database lookups, remote web service calls, stitching together HTML, etc. The “frontend” time is everything else. This includes obvious frontend phases like executing JavaScript and rendering the page. It also includes network time for downloading all the resources referenced in the page. I include this in the frontend time because there’s a great deal web developers can do to reduce this time, such as async script loading, concatenating scripts and stylesheets, and sharding domains.
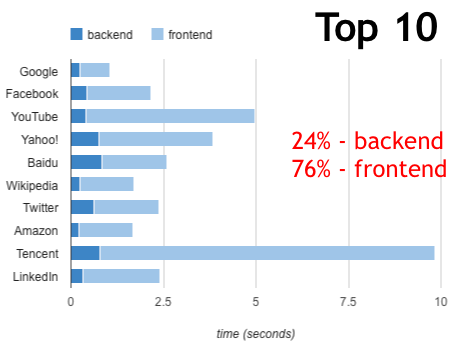
For some real world results I look at the frontend/backend split for Top 10 websites. The average frontend time is 76%, slightly lower than the 80-90% advertised in the Performance Golden Rule. But remember that these sites have highly optimized frontends, and two of them are search pages (not results) that have very few resources.
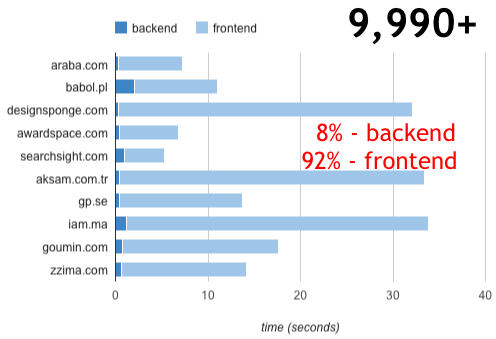
For a more typical view I looked at 10 sites ranked around 10,000. The frontend time is 92%, higher than the 76% of the Top 10 sites and even higher than the 80-90% suggested by the Performance Golden Rule.
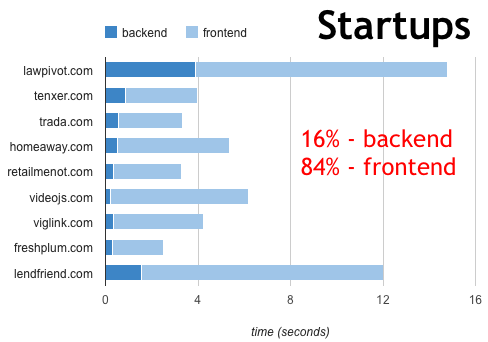
To bring this rule home to the attendees I showed the backend and frontend times for their websites. The frontend time was 84%. This helped me get their agreement that the longest pole in the tent was frontend performance and that was the place to focus.
Afterward I realized that I have timing information in the HTTP Archive. I generally don’t show these time measurements because I think real user metrics are more accurate, but I calculated the split across all 50,000 websites that are being crawled. The frontend time is 87%.
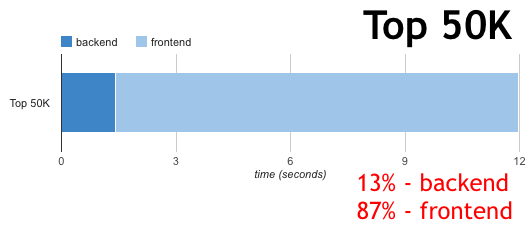
It’s great to have this updated information that shows the Performance Golden Rule is as accurate now as it was back in 2007, and points to the motivation for focusing on frontend optimizations. If you’re worried about availability and scalability, focus on the backend. But if you’re worried about how long users are waiting for your website to load focusing on the frontend is your best bet.
姬光 | 10-Feb-12 at 11:25 pm | Permalink |
Here is a Chinese version(这里有ä¸æ–‡ç‰ˆï¼‰ï¼šhttp://44ux.com/index.php/2012/02/the-performance-golden-rule/
Tony Gentilcore | 11-Feb-12 at 3:54 am | Permalink |
Great post. Firmly agree with the conclusion, but might be useful to caveat that this assumes server time is negligible for resources other than the main resource. That might be true for a lot of sites that use mainly static resources, but you could certainly imagine, for example, a site including dynamic data via JSONP that would both block parsing and be expensive to generate on the backend.
Steve Souders | 11-Feb-12 at 8:07 am | Permalink |
@Tony: Yes, the frontend/backend definition is a general guideline. But to your point, those JSONP requests are done with XHR or dynamic scripts which don’t block other downloads nor rendering, so even if they are slower because of *backend* computing they’re going to have less of an effect on the user experience than a slow HTML document. But in the end you’re right: there is more backend processing involved for Web 2.0-ish sites.
Shiva Vannavada | 11-Feb-12 at 10:31 am | Permalink |
Totally agree with this. We concentrated heavily to optimize lg.com/us UI and getting stellar results with UI performance. Parallel JS loading, component framework and progressive enhancements made a big difference.
Drew Wells | 12-Feb-12 at 3:15 pm | Permalink |
Not to be confused with the other Golden Rule http://grooveshark.com/#!/s/3+Way+The+Golden+Rule+Ft+Lady+Gaga/3P8K2y?src=5
We are currently sitting at a 93% front end 7% back end. Almost half of that time is spent requesting iframes for social media plugins :/
sam | 12-Feb-12 at 7:48 pm | Permalink |
I had a look at https://www.lawpivot.com/b/ which does have a lot to be desired around deferred script loading and bundling and sprites, etc. However on second load most of the stuff is cached and you are left with a constant 1.8 second tax due to the backend.
I think it is fairly important to run the same comparisons on repeat views. Clearly initial views are going to have huge front end tax.
Mark | 13-Feb-12 at 5:27 am | Permalink |
@Sam: Good point. That first impression is extremely important, though, especially with someone loading your site for the very first time (which implies they are not a repeat customer/visitor, except for those that regularly clear their caches).
Steve Souders | 13-Feb-12 at 7:45 am | Permalink |
@Sam: Good point about repeat view, but it’s not as rosy as you might think. First, as Mark points out the first page load has a major effect on the user’s impression of your website – so it’s important that it be fast. Second, the repeat page view is fast if the resources are all cached, but about half your daily users have an empty cache at least once during the day when they hit your site, so the empty cache impression occurs frequently. Third, a repeat view on mobile is doubly worse because even if the resources are in the cache the Conditional GET requests are going to be much slower (due to slower network connections) and in fact the resources are less likely to be cached because mobile cache sizes are very small. It’s best to focus on the empty cache scenario and optimize that as much as possible.
Puneet Lamba | 13-Feb-12 at 10:53 am | Permalink |
Sorry, but this has not been my experience. I typically see disk access as being the bottleneck. So, database queries where results aren’t cached take up the largest component of time.
Also, I’m curious, how did you calculate the split, e.g. for LinkedIn, without having access to their logs?
Alex Podelko | 13-Feb-12 at 11:10 am | Permalink |
Steve,
What pages were included in this statistics (included in the crawl)? I’d expect that the back end share would be large for such transactions as submit order, retrieve order status, search, etc.
Steve Souders | 13-Feb-12 at 11:20 am | Permalink |
@Puneet: The backend time is a portion of the time spent fetching the HTML document. You can see the HTML document total time in the waterfall chart (in this case 460 ms). If you have any examples where backend time takes a majority of page load time please add them here.
@Alex: Please see this FAQ for where the list of URLs comes from. It’s based on Alexa. You can also download the data.
Rob Flaherty | 13-Feb-12 at 12:32 pm | Permalink |
I think the reason back end developers challenge this claim is that the back end (i.e. the return of the document) is still the *single* biggest performance factor. Database queries are the *single* biggest bottleneck. But in aggregate the front end dominates so it makes sense to focus there, assuming the back end is properly built for performance.
I’d also mention that while front end waiting takes more time, back end waiting is usually more painful, more expensive for the user. Staring at a white screen while uncached WordPress takes 3 seconds to return HTML is excruciating. Waiting 3 seconds for images and JS to finish downloading is sometimes not that bad.
Tenni Theurer | 13-Feb-12 at 1:18 pm | Permalink |
Great post! This brings back fond memories…
Puneet Lamba | 13-Feb-12 at 2:02 pm | Permalink |
Steve, clarification — I’m not referring to public web sites but to software me and my teams have developed or worked with. I would imagine that there should be public sites that exhibit the same behavior as long as they are disk read/write intensive.
Scott Russell | 13-Feb-12 at 8:06 pm | Permalink |
Hi,
The data here is highly skewed, to “home pages”. Most performance tuning for applications involves several use cases, and these would involve several journeys, through the site. Each use case would tend to be allotted a percentage load ie 5% of users executing use case 1, 15% of users executing case 2 etc. Normally you would run these in a 2 hour test. The analysis would normally split the content between static pages(apache) and dynamic(jboss/db). This split normally has to be done with access to backend logs and quite often reference to developers for specific url`s. Not taking anything away from the front-end work, but in the corporate world, it is all about the dynamic components and just how badly individual dynamic uurl’s perform, especially under heavy loading and concentrating on reducing the spread of the response time and not necessarily making the response faster. A lot more coverage of dynamic content during journeys through websites(ie purchasing a book on amazon) would be appreciated.
Sergey Chernyshev | 13-Feb-12 at 8:53 pm | Permalink |
Thanks Steve, great post, transports me back to that talk at Web 2.0 Conference back in 2007.
Thanks to you and Tenni for bringing me to the light side of the force…
Rebellion must recruit all WPOokies and C-3WPOs to fight back against the back-end empire ;)
Steve Souders | 13-Feb-12 at 9:28 pm | Permalink |
@Scott: These stats are true for both dynamic and static pages. All of the pages in the Top 10, 9990+, and Startups are dynamic and yet still are 76-92% frontend. The bigger difference you raise when discussing a flow (like purchasing a book) is empty cache vs primed cache. These stats are only empty cache. Even primed cache is heavily weighted to frontend. I’ll try to run those stats tomorrow and report back here.
@Sergey: I got a tweet from Tenni about this post. She and I both did that very first presentation at Web 2.0 Expo in 2007. Seems so long ago.
Mark Nottingham | 13-Feb-12 at 9:40 pm | Permalink |
I think that back-end perf gets more attention (relatively) because it’s in the developers’ face more.
With common architectures (especially Apache prefork), if you have a slow back end, it directly limits your scalability, and you can’t not know you have a problem; your site goes down, or gets absurdly slow even from a browser that’s on the same ethernet segment as the server.
Front-end is more subtle; the work is on the browser, and to many engineers, if it’s not happening on their CPU, they don’t care. You also have to take network latency and loss into account, which is voodoo to many engineers (especially those that have never administered a server!).
This is changing — thanks both to the front-end perf movement (nod to you, Steve :), but also because back-end architecture is changing too, with non-traditional server architecures like Node.JS. In this approach, the latency of the back-end request doesn’t directly affect scalability, getting one distraction out of the developers’ way (he says, hopefully).
Anyway, good stuff.
Scott Russell | 16-Feb-12 at 7:10 pm | Permalink |
@Steve. Further to my earlier comments, take for example JS files. Sometimes these are static files served from apache, other times they may be served from tomcat(static but dynamically served), other times they are dynamically created by tomcat using a backend db(ie subject to full GC). So simply assuming all JS files are static (or indeed dynamic) is an approximation. Was wandering if this is the underlying assumption, that you are allocating static or dynamic based on file type and not on the layer they are served from?
As a rule of thumb, assuming no access to server logs, I make the following assumption, url’s with maximum response times of less than 500ms are static, (this would be combined with knowing that there have been full GC On the backend of >500ms). All very java specific I’m fraid. And again based on a use case of maybe 100 users continuous across two hours or so.
Fabio Buda | 17-Feb-12 at 6:14 am | Permalink |
@Scott, you should not consider the time your backend takes to create a js file.
What matters (in Steve analisys) is the time ratio between the first byte and the complete loading of the page.
In my humble opinion this kind of analisys is a little rough but also very useful to know how fast the page will be loaded in your user’s browser because the frontend takes time not only to download external resources but also to parse and compile js files as well as render the page following all CSS rules.
Know the time ratio is useful to make strategic decisions like: What should I optimize? Backend or Frontend?
Obviously you could also consider Backend time for your dynamically generated scripts but you should also analyze ratio between the amount of time a server takes to give a response, network latency and the time a browser takes to parse the script… But this would be another issue.
Jon | 17-Feb-12 at 8:27 am | Permalink |
Hey, Steve. Awesome post, as usual. Quick question, though…what tool did you use to get the back end and front end times in the waterfalls?
Steve Souders | 17-Feb-12 at 8:33 am | Permalink |
@Scott: Please see my reply to @Tony (comment #3). @Fabio is right on (thx!).
@Jon: The waterfalls are from WebPagetest.
Charles | 17-Feb-12 at 9:16 pm | Permalink |
Good stuff Steve,once I set up supercache, minify, and browser cache I went from page speed of 65 to 89. Not surprisingly my bounce rate lowered and rankings are improving. Thanks for the detailed info
Ricardo B | 19-Feb-12 at 3:44 pm | Permalink |
It would be nice if yslow and page speed calculate this measure ( frontend vs backend) If suggest this I am sure tey will both implement this feature.
Ben Daniel | 14-Mar-12 at 3:45 am | Permalink |
Steve – we’ve been talking about the 80 / 20 rule for some time and have tried to follow our thoughts through with a short piece of analysis – http://blog.siteconfidence.com/2012/03/querying-80-20-rule.html.
What’re your thoughts?
Lucas Sandoval | 15-Mar-12 at 8:39 am | Permalink |
hey steve, your high performance web site book will get a update?