ControlJS part 1: async loading
This is the first of three blog posts about ControlJS – a JavaScript module for making scripts load faster. The three blog posts describe how ControlJS is used for async loading, delayed execution, and overriding document.write.
The #1 performance best practice I’ve been evangelizing over the past year is progressive enhancement: deliver the page as HTML so it renders quickly, then enhance it with JavaScript. There are too many pages that are blank while several hundred kB of JavaScript is downloaded, parsed, and executed so that the page can be created using the DOM.
It’s easy to evangelize progressive enhancement – it’s much harder to actually implement it. That several hundred kB of JavaScript has to be unraveled and reorganized. All the logic that created DOM elements in the browser via JavaScript has to be migrated to run on the server to generate HTML. Even with new server-side JavaScript capabilities this is a major redesign effort.
I keep going back to Opera’s Delayed Script Execution option. Just by enabling this configuration option JavaScript is moved aside so that page rendering can come first. And the feature works – I can’t find a single website the suffers any errors with this turned on. While I continue to encourage other browser vendors to implement this feature, I want a way for developers to get this behavior sooner rather than later.
A number of web accelerators (like Aptimize, Strangeloop, FastSoft, CloudFlare, Torbit, and more recently mod_pagespeed) have emerged over the last year or so. They modify the HTML markup to inject performance best practices into the page. Thinking about this model I considered ways that markup could be changed to more easily delay the impact of JavaScript on progressive rendering.
The result is a JavaScript module I call ControlJS.
Controlling download and execution
The goal of ControlJS is to give developers more control over how JavaScript is loaded. The key insight is to recognize that “loading” has two phases: download (fetching the bytes) and execution (including parsing). These two phases need to be separated and controlled for best results.
Controlling how scripts are downloaded is a popular practice among performance-minded developers. The issue is that when scripts are loaded the normal way (<script src=""...) they block other resource downloads (lesser so in newer browsers) and also block page rendering (in all browsers). Using asynchronous script loading techniques mitigates these issues to a large degree. I wrote about several asynchronous loading techniques in Even Faster Web Sites. LABjs and HeadJS are JavaScript modules that provide wrappers for async loading. While these async techniques address the blocking issues that occur during the script download phase, they don’t address what happens during the script execution phase.
Page rendering and new resource downloads are blocked during script execution. With the amount of JavaScript on today’s web pages ever increasing, the blocking that occurs during script execution can be significant, especially for mobile devices. In fact, the Gmail mobile team thought script execution was such a problem they implemented a new async technique that downloads JavaScript wrapped in comments. This allows them to separate the download phase from the execution phase. The JavaScript is downloaded so that it resides on the client (in the browser cache) but since it’s a comment there’s no blocking from execution. Later, when the user invokes the associated features, the JavaScript is executed by removing the comment and evaluating the code.
Stoyan Stefanov, a former teammate and awesome performance wrangler, recently blogged about preloading JavaScript without execution. His approach is to download the script as either an IMAGE or an OBJECT element (depending on the browser). Assuming the proper caching headers exist the response is cached on the client and can later be inserted as a SCRIPT element. This is the technique used in ControlJS.
ControlJS: how to use it
To use ControlJS you need to make three modifications to your page.
Modification #1: add control.js
I think it’s ironic that JavaScript modules for loading scripts asynchronously have to be loaded in a blocking manner. From the beginning I wanted to make sure that ControlJS itself could be loaded asynchronously. Here’s the snippet for doing that:
var cjsscript = document.createElement('script');
cjsscript.src = "control.js";
var cjssib = document.getElementsByTagName('script')[0];
cjssib.parentNode.insertBefore(cjsscript, cjssib);
Modification #2: change external scripts
The next step is to transform all of the old style external scripts to load the ControlJS way. The normal style looks like this:
<script type="text/javascript" src="main.js"><script>
The SCRIPT element’s TYPE attribute needs to be changed to “text/cjs” and the SRC attribute needs to be changed to DATA-CJSSRC, like this:
<script type="text/cjs" data-cjssrc="main.js"><script>
Modification #3: change inline scripts
Most pages have inline scripts in addition to external scripts. These scripts have dependencies: inline scripts might depend on external scripts for certain symbols, and vice versa. It’s important that the execution order of the inline scripts and external scripts is preserved. (This is a feature that some of the async wrappers overlook.)Â Therefore, inline scripts must also be converted by changing the TYPE attribute from “text/javascript” in the normal syntax:
<script type="text/javascript">
var name = getName();
<script>
to “text/cjs”, like this:
<script type="text/cjs">
var name = getName();
<script>
That’s it! ControlJS takes care of the rest.
ControlJS: how it works
Your existing SCRIPTs no longer block the page because the TYPE attribute has been changed to something the browser doesn’t recognize. This allows ControlJS to take control and load the scripts in a more high performance way. Let’s take a high-level look at how ControlJS works. You can also view the control.js script for more details.
We want to start downloading the scripts as soon as possible. Since we’re downloading them as an IMAGE or OBJECT they won’t block the page during the download phase. And since they’re not being downloaded as a SCRIPT they won’t be executed. ControlJS starts by finding all the SCRIPT elements that have the “text/cjs” type. If the script has a DATA-CJSSRC attribute then an IMAGE (for IE and Opera) or OBJECT (for all other browsers) is created dynamically with the appropriate URL. (See Stoyan’s post for the full details.)
By default ControlJS waits until the window load event before it begins the execution phase. (It’s also possible to have it start executing scripts immediately or once the DOM is loaded.) ControlJS iterates over its scripts a second time, doing so in the order they appear in the page. If the script is an inline script the code is extracted and evaluated. If the script is an external script and its IMAGE or OBJECT download has completed then it’s inserted in the page as a SCRIPT element so that the code is parsed and executed. If the IMAGE or OBJECT download hasn’t finished then it reenters the iteration after a short timeout and tries again.
There’s more functionality I’ll talk about in later posts regarding document.write and skipping the execution step. For now, let’s look at a simple async loading example.
Async example
To show ControlJS’s async loading capabilities I’ve created an example that contains three scripts in the HEAD:
- main.js – takes 4 seconds to download
- an inline script that references symbols from main.js
- page.js – takes 2 seconds to download and references symbols from the inline script
I made page.js take less time than main.js to make sure that the scripts are executed in the correct order (even though page.js downloads more quickly). I include the inline script because this is a pattern I see frequently (e.g., Google Analytics) but many script loader helpers don’t support inline scripts as part of the execution order.
Async withOUT ControlJS is the baseline example. It loads the scripts in the normal way. The HTTP waterfall chart generated in IE8 (using HttpWatch) is shown in Figure 1. IE8 is better than IE 6&7 – it loads scripts in parallel so main.js and page.js are downloaded together. But all versions of IE block image downloads until scripts are done, so images 1-4 get pushed out. Rendering is blocked by scripts in all browsers. In this example, main.js blocks rendering for four seconds as indicated by the green vertical line.

Figure 1: Async withOUT ControlJS waterfall chart (IE8)
Async WITH ControlJS demonstrates how ControlJS solves the blocking problems caused by scripts. Unlike the baseline example, the scripts and images are all downloaded in parallel shaving 1 second off the overall download time. Also, rendering starts immediately. If you load the two examples in your browser you’ll notice how dramatically faster the ControlJS page feels. There are three more requests in Figure 2’s waterfall chart. One is the request for control.js – this is loaded asynchronously so it doesn’t slow down the page. The other two requests are because main.js and page.js are loaded twice. The first time is when they are downloaded asynchronously as IMAGEs. Later, ControlJS inserts them into the page as SCRIPTs in order to get their JavaScript executed. Because main.js and page.js are already in the cache there’s no download penalty, only the short cache read indicated by the skinny blue line.

Figure 2: Async WITH ControlJS waterfall chart (IE8)
The ControlJS project
ControlJS is open source under the Apache License. The control.js script can be found in the ControlJS Google Code project. Discussion topics can be created in the ControlJS Google Group. The examples and such are on my website at the ControlJS Home Page. I’ve written this code as a proof of concept. I’ve only tested it on the major browsers. It needs more review before being used in a production environment.
Only part 1
This is only the first of three blog posts about ControlJS. There’s more to learn. This technique might seem like overkill. If all we wanted to do was load scripts asynchronously some other techniques might suffice. But my goal is to delay all scripts until after the page has rendered. This means that we have to figure out how to delay scripts that do document.write. Another goal is to support requirements like Gmail mobile had – the desire to download JavaScript but delay the blocking penalties that come during script execution. I’ll be talking about those features in the next two blog posts.
var name = getName();
Evolution of Script Loading
Velocity China starts tomorrow morning. I’m kicking it off with a keynote and am finishing up my slides. I’ll be talking about progressive enhancement and smart script loading. As I reviewed the slides it struck me how the techniques for loading external scripts have changed significantly in the last few years. Let’s take a look at what we did, where we are now, and try to see what the future might be.
Scripts in the HEAD
Just a few years ago most pages, even for the top websites, loaded their external scripts with HTML in the HEAD of the document:
<head> <script src=â€core.js†type=â€text/javascriptâ€></script> <script src=â€more.js†type=â€text/javascriptâ€></script> </head>
Developers in tune with web performance best practices cringe when they see scripts loaded this way. We know that older browsers (now that’s primarily Internet Explorer 6 & 7) load scripts sequentially. The browser downloads core.js and then parses and executes it. Then it does the same with more.js – downloads the script and then parses and executes it.
In addition to loading scripts sequentially, older browsers block other downloads until this sequential script loading phase is completed. This means there may be a significant delay before these browsers even start downloading stylesheets, images, and other resources in the page.
These download issues are mitigated in newer browsers (see my script loading roundup). Starting with IE 8, Firefox 3.6, Chrome 2, and Safari 4 scripts generally get downloaded in parallel with each other as well as with other types of resources. I say “generally†because there are still quirks in how browsers perform this parallel script loading. In IE 8 and 9beta, for example, images are blocked from being downloaded during script downloads (see this example). In a more esoteric use case, Firefox 3 loads scripts that are document.written into the page sequentially rather than in parallel.
Then there’s the issue with rendering being blocked by scripts: any DOM elements below a SCRIPT tag won’t be rendered until that script is finished loading. This is painful. The browser has already downloaded the HTML document but none of those Ps, DIVs, and ULs get shown to the user if there’s a SCRIPT above them. If you put the SCRIPT in the document HEAD then the entire page is blocked from rendering.
There are a lot of nuances in how browsers load scripts especially with the older browsers. Once I fully understood the impact scripts had on page loading I came up with my first recommendation to improve script loading:
Move Scripts to the Bottom
Back in 2006 and 2007 when I started researching faster script loading, all browsers had the same problems when it came to loading scripts:
- Scripts were loaded sequentially.
- Loading a script blocked all other downloads in the page.
- Nothing below the SCRIPT was rendered until the script was done loading.
The solution I came up with was to move the SCRIPT tags to the bottom of the page.
... <script src=â€core.js†type=â€text/javascriptâ€></script> <script src=â€more.js†type=â€text/javascriptâ€></script> </body>
This isn’t always possible, for example, scripts for ads that do document.write can’t be moved – they have to do their document.write in the exact spot where the ad is supposed to appear. But many scripts can be moved to the bottom of the page with little or no work. The benefits are immediately obvious – images download sooner and the page renders more quickly. This was one of my top recommendations in High Performance Web Sites. Many websites adopted this change and saw the benefits.
Load Scripts Asynchronously
Moving scripts to the bottom of the page avoided some problems, but other script loading issues still existed. During 2008 and 2009 browsers still downloaded scripts sequentially. There was an obvious opportunity here to improve performance. Although it’s true that scripts (often) need to be executed in order, they don’t need to be downloaded in order. They can be downloaded in any order – as long as the browser preserves the original order of execution.
Browser vendors realized this. (I like to think that I had something to do with that.) And newer browsers (starting with IE8, Firefox 3.6, Chrome 2, and Safari 4 as mentioned before) started loading scripts in parallel. But back in 2008 & 2009 sequential script loading was still an issue. I was analyzing MSN.com one day and noticed that their scripts loaded in parallel – even though this was back in the Firefox 2.0 days. They were using the Script DOM Element approach:
var se = document.createElement("script");
se.src = "core.js";
document.getElementsByTagName("head")[0].appendChild(se);
I’ve spent a good part of the last few years researching asynchronous script loading techniques like this. These async techniques (summarized in this blog post with full details in chapter 4 of Even Faster Web Sites) achieve parallel script loading in older browsers and avoid some of the quirks in newer browsers. They also mitigate the issues with blocked rendering: when a script is loaded using an async technique the browser charges ahead and renders the page while the script is being downloaded. This example has a script in the HEAD that’s loaded using the Script DOM Element technique. This script is configured to take 4 seconds to download. When you load the URL you’ll see the page render immediately, proving that rendering proceeds when scripts are loaded asynchronously.
Increased download parallelism and faster rendering – what more could you want? Well…
Async + On-demand Execution
Loading scripts asynchronously speeds up downloads (more parallelism) and rendering. But – when the scripts arrive at the browser rendering stops and the browser UI is locked while the script is parsed and executed. There wouldn’t be any room for improvement here if all that JavaScript was needed immediately, but websites don’t use all the code that’s downloaded – at least not right away. The Alexa US Top 10 websites download an average of 229 kB of JavaScript (compressed) but only execute 29% of those functions by the time the load event fires. The other 71% of code is cruft, conditional blocks, or most likely DHTML and Ajax functionality that aren’t used to render the initial page.
This discovery led to my recommendation to split the initial JavaScript download into the code needed to render the page and the code that can be loaded later for DHTML and Ajax features. (See this blog post or chapter 3 of EFWS.) Websites often load the code that’s needed later in the window’s onload handler. The Gmail Mobile team found wasn’t happy with the UI locking up when that later code arrived at the browser. After all, this DHTML/Ajaxy code might not even be used. They’re the first folks I saw who figured out a way to separate the download phase from the parse-execute phase of script loading. They did this by wrapping all the code in a comment, and then when the code is needed removing the comment delimiters and eval’ing. Gmail’s technique uses iframes so requires changing your existing scripts. Stoyan has gone on to explore using image and object tags to download scripts without the browser executing them, and then doing the parse-execute when the code is needed.
What’s Next?
Web pages are getting more complex. Advanced developers who care about performance need more control over how the page loads. Giving developers the ability to control when an external script is parsed and executed makes sense. Right now it’s way too hard. Luckily, help is on the horizon. Support for LINK REL=”PREFETCH” is growing. This provides a way to download scripts while avoiding parsing and execution. Browser vendors need to make sure the LINK tag has a load event so developers can know whether or not the file has finished downloading. Then the file that’s already in the browser’s cache can be added asynchronously using the Script DOM Element approach or some other technique only when the code is actually needed.
We’re close to having the pieces to easily go to the next level of script loading optimization. Until all the pieces are there, developers on the cutting edge will have to do what they always do – work a little harder and stay on top of the latest best practices. For full control over when scripts are downloaded and when they’re parsed and executed I recommend you take a look at the posts from Gmail Mobile and Stoyan.
Based on the past few years I’m betting there are more improvements to script loading still ahead.
Render first. JS second.
Let me start with the takeaway point:
The key to creating a fast user experience in today’s web sites is to render the page as quickly as possible. To achieve this JavaScript loading and execution has to be deferred.
I’m in the middle of several big projects so my blogging rate is down. But I got an email today about asynchronous JavaScript loading and execution. I started to type up my lengthy response and remembered one of those tips for being more productive: “type shorter emails – no one reads long emails anyway”. That just doesn’t resonate with me. I like typing long emails. I love going into the details. But, I agree that an email response that only a few people might read is not the best investment of time. So I’m writing up my response here.
It took me months to research and write the “Loading Scripts Without Blocking” chapter from Even Faster Web Sites. Months for a single chapter! I wasn’t the first person to do async script loading – I noticed it on MSN way before I started that chapter – but that work paid off. There has been more research on async script loading from folks like Google, Facebook and Meebo. Most JavaScript frameworks have async script loading features – two examples are YUI and LABjs. And 8 of today’s Alexa Top 10 US sites use advanced techniques to load scripts without blocking: Google, Facebook, Yahoo!, YouTube, Amazon, Twitter, Craigslist(!), and Bing. Yay!
The downside is – although web sites are doing a better job of downloading scripts without blocking, once those scripts arrive their execution still blocks the page from rendering. Getting the content in front of the user as quickly as possible is the goal. If asynchronous scripts arrive while the page is loading, the browser has to stop rendering in order to parse and execute those scripts. This is the biggest obstacle to creating a fast user experience. I don’t have scientific results that I can cite to substantiate this claim (that’s part of the big projects I’m working on). But anyone who disables JavaScript in their browser can attest that sites feel twice as fast.
My #1 goal right now is to figure out ways that web sites can defer all JavaScript execution until after the page has rendered. Achieving this goal is going to involve advances from multiple camps – changes to browsers, new web development techniques, and new pieces of infrastructure. I’ve been talking this up for a year or so. When I mention this idea these are the typical arguments I hear for why this won’t work:
In response to this argument I point to Opera’s Delayed Script Execution feature. I encourage you to turn it on, surf around, and try to find a site that breaks. Even sites like Gmail and Facebook work! I’m sure there are some sites that have problems (perhaps that’s why this feature is off by default). But if some sites do have problems, how many sites are we talking about? And what’s the severity of the problems? We definitely don’t want errors, rendering problems, or loss of ad revenue. Even though Opera has had this feature for over two years (!), I haven’t heard much discussion about it. Imagine what could happen if significant resources focused on this problem.
What are the next steps?
- Browsers should look at Opera’s behavior and implement the SCRIPT ASYNC and DEFER attributes.
- Developers should adopt asynchronous script loading techniques and avoid rendering the initial page view with JavaScript on the client.
- Third party snippet providers, most notably ads, need to move away from document.write.
newtwitter performance analysis
Among the exciting launches last week was newtwitter – the amazing revamp of the Twitter UI. I use Twitter a lot and was all over the new release, and so was stoked to see this tweet from Twitter developer Ben Cherry:

The new Twitter UI looks good, but how does it score when it comes to performance? I spent a few hours investigating. I always start with HTTP waterfall charts, typically generated by HttpWatch. I look at Firefox and IE because they’re the most popular browsers (and I use a lot of Firefox tools). Here’s the waterfall chart for Firefox 3.6.10:

I used to look at IE7 but its market share is dropping, so now I start with IE8. Here’s the waterfall chart for IE8:

From the waterfall charts I generate a summary to get an idea of the overall page size and potential for problems.
| Firefox 3.6.10 | IE8 | |
|---|---|---|
| main content rendered | ~4 secs | ~5 secs |
| window onload | ~2 secs | ~7 secs |
| network activity done | ~5 secs | ~7 secs |
| # requests | 53 | 52 |
| total bytes downloaded | 428 kB | 442 kB |
| JS bytes downloaded | 181 kB | 181 kB |
| CSS bytes downloaded | 21 kB | 21 kB |
I study the waterfall charts looking for problems, primarily focused on places where parallel downloading stops and where there are white gaps. Then I run Page Speed and YSlow for more recommendations. Overall newtwitter does well, scoring 90 on Page Speed and 86 on YSlow. Combining all of this investigation results in this list of performance suggestions:
- Script Loading – The most important thing to do for performance is get JavaScript out of the way. “Out of the way” has two parts:
- blocking downloads – Twitter is now using the new Google Analytics async snippet (yay!) so ga.js isn’t blocking. However, base.bundle.js is loaded using normal SCRIPT SRC, so it blocks. In newer browsers there will be some parallel downloads, but even IE9 will block images until the script is done downloading. In both Firefox and IE it’s clear this is causing a break in parallel downloads. phoenix.bundle.js and api.bundle.js are loaded using LABjs in conservative mode. In both Firefox and IE there’s a big block after these two scripts. It could be LABjs missing an opportunity, or it could be that the JavaScript is executing. But it’s worth investigating why all the resources lower in the page (~40 of them) don’t start downloading until after these scripts are fetched. It’d be better to get more parallelized downloads.
- blocked rendering – The main part of the page takes 4-5 seconds to render. In some cases this is because the browser won’t render anything until all the JavaScript is downloaded. However, in this page the bulk of the content is generated by JS. (I concluded this after seeing that many of the image resources are specified in JS.) Rather than download a bunch of scripts to dynamically create the DOM, it’d be better to do this on the server side as HTML as part of the main HTML document. This can be a lot of work, but the page will never be fast for users if they have to wait for JavaScript to draw the main content in the page. After the HTML is rendered, the scripts can be downloaded in the background to attach dynamic behavior to the page.
- scattered inline scripts – Fewer inline scripts are better. The main reason is that a stylesheet followed by an inline script blocks subsequent downloads. (See Positioning Inline Scripts.) In this page, phoenix.bundle.css is followed by the Google Analytics inline script. This will cause the resources below that point to be blocked – in this case the images. It’d be better to move the GA snippet to the SCRIPT tag right above the stylesheet.
- Optimize Images – This one image alone could be optimized to save over 40K (out of 52K): http://s.twimg.com/a/1285108869/phoenix/img/tweet-dogear.png.
- Expires header is missing – Strangely, some images are missing both the Expires and Cache-Control headers, for example, http://a2.twimg.com/profile_images/30575362/48_normal.png. My guess is this is an origin server push problem.
- Cache-Control header is missing – Scripts from Amazon S3 have an Expires header, but no Cache-Control header (eg http://a2.twimg.com/a/1285097693/javascripts/base.bundle.js). This isn’t terrible, but it’d be good to include Cache-Control: max-age. The reason is that Cache-Control: max-age is relative (“# of seconds from right now”) whereas Expires is absolute (“Wed, 21 Sep 2011 20:44:22 GMT”). If the client has a skewed clock the actual cache time could be different than expected. In reality this happens infrequently.
- redirect – http://www.twitter.com/ redirects to http://twitter.com/. I love using twitter.com instead of www.twitter.com, but for people who use “www.” it would be better not to redirect them. You can check your logs and see how often this happens. If it’s small (< 1% of unique users per day) then it’s not a big problem.
- two spinners – Could one of these spinners be eliminated: http://twitter.com/images/spinner.gif and http://twitter.com/phoenix/img/loader.gif ?
- mini before profile – In IE the “mini” images are downloaded before the normal “profile” images. I think the profile images are more important, and I wonder why the order in IE is different than Firefox.
- CSS cleanup – Page Speed reports that there are > 70 very inefficient CSS selectors.
- Minify – Minifying the HTML document would save ~5K. Not big, but it’s three roundtrips for people on slow connections.
Overall newtwitter is beautiful and fast. Most of the Top 10 web sites are using advanced techniques for loading JavaScript. That’s the key to making today’s web apps fast.
Diffable: only download the deltas
There were many new products and projects announced at Velocity, but one that I just found out about is Diffable. It’s ironic that I missed this one given that it happened at Velocity and is from Google. The announcement was made during a whiteboard talk, so it didn’t get much attention. If your web site has large JavaScript downloads you’ll want to learn more about this performance optimization technique.
The Diffable open source project has plenty of information, including the Diffable slides used by Josh Harrison and James deBoer at Velocity. As explained in the slides, Diffable uses differential compression to reduce the size of JavaScript downloads. It makes a lot of sense. Suppose your web site has a large external script. When a new release comes out, it’s often the case that a bulk of that large script is unchanged. And yet, users have to download the entire new script even if the old script is still cached.
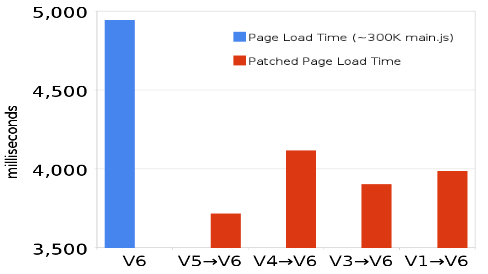
Josh and James work on Google Maps which has a main script that is ~300K. A typical revision for this 300K script produces patches that are less than 20K. It’s wasteful to download that other 280K if the user has the old revision in their cache. That’s the inspiration for Diffable.
Diffable is implemented on the server and the client. The server component records revision deltas so it can return a patch to bring older versions up to date. The client component (written in JavaScript) detects if an older version is cached and if necessary requests the patch to the current version. The client component knows how to merge the patch with the cached version and evals the result.
The savings are significant. Using Diffable has reduced page load times in Google Maps by more than 1200 milliseconds (~25%). Note that this benefit only affects users that have an older version of the script in cache. For Google Maps that’s 20-25% of users.
In this post I’ve used scripts as the example, but Diffable works with other resources including stylesheets and HTML. The biggest benefit is with scripts because of their notorious blocking behavior. The Diffable slides contain more information including how JSON is used as the delta format, stats that show there’s no performance hit for using eval, and how Diffable also causes the page to be enabled sooner due to faster JavaScript execution. Give it a look.
Velocity: Google Maps API performance
Several months ago I saw Susannah Raub do an internal tech talk on the performance improvements behind Google Maps API v3. She kindly agreed to reprise the talk at Velocity. Luckily it was videotaped, and the slides (ODP) are available, too. It’s a strong case study on improving performance, is valuable for developers working with the Google Maps API, and has a few takeaways that I’ll blog about more soon.
Susannah starts off bravely by showing how Google Maps API v2 takes 17 seconds to load on an iPhone. This was the motivation for the work on v3 – to improve performance. In order to improve performance you have to start by measuring it. The Google Maps team broke down “performance” into three categories:
- user perceived latency – how long it takes for the page to appear usable, in this case for the map to be rendered
- page ready time – how long it takes for the page to become usable, e.g. for the map to be draggable
- page load time – how long it takes for all the elements to be present, in the case of maps this includes all of the map controls to be loaded and working
The team wanted to measure all of these areas. It’s fairly easy to find tools to measure performance on the desktop – the Google Maps teamed used HttpWatch. Performance tools, or any development tools for that matter, are harder to come by in the mobile space. But the team especially wanted to focus on creating a fast experience on mobile devices. They ended up using Fiddler as a proxy to gain visibility into the page’s performance profile.
future blog post #1: Coincidentally, today I saw a tweet about Craig Dunn’s instructions for Monitoring iPhone web traffic (with Fiddler). This is a huge takeaway for anyone doing web development for mobile. At Velocity, Eric Lawrence (creator of Fiddler) announced Fiddler support for the HTTP Archive Specification. The HTTP Archive (HAR) format is a specification I initiated over a year ago with folks from HttpWatch and Firebug. HAR is becoming the industry standard just as I had hoped and is now supported in numerous developer tools. I wrote one such tool, called HAR to Page Speed, that takes a HAR file and displays a Page Speed performance analysis as well as an HTTP waterfall chart. Putting all these pieces together, you can now load a web site on your iPhone, monitor it with Fiddler, export it to a HAR file, and upload it to HAR to Page Speed to find out how it performs. Given Fiddler’s extensive capabilities for creating addons, I expect it won’t be long before all of this is built into Fiddler itself.
In the case of Google Maps API, the long pole in the tent was main.js. They have a small (15K) bootstrap script that loads main.js (180K). (All of the script sizes in this blog post are UNcompressed sizes.) The performance impact of main.js was especially bad on mobile devices because of less caching. They compiled their JavaScript (using Closure) and combined three HTTP requests into one.
future blog post #2: The team also realized that although their JavaScript download was large, the revisions between releases was small. They created a framework for only downloading deltas when possible that cut seconds off their download times. More on this tomorrow.
These performance improvements helped, but they wanted to go further. They redesigned their code using an MVC architecture. As a result, the initial download only needs to include the models, which are small. The larger views and controllers that do all the heavy lifting are loaded asynchronously. This reduced the initial bootstrap script from 15K to 4K, and the main.js from 180K to 33K.
The results speak for themselves. Susannah concludes by showing how v3 of Google Maps API takes only 5 seconds to load on the iPhone, compared to v2’s 17 seconds. The best practices the team employed for making Google Maps faster are valuable for anyone working on JavaScript-heavy web sites. Take a look at the video and slides, and watch here for a follow-up on Fiddler for iPhone and loading JavaScript deltas.
appendChild vs insertBefore
I’ve looked at a bunch of third party JavaScript snippets as part of my P3PC series. As I analyzed each of these snippets, I looked to see if scripts were being loaded dynamically. After all, this is a key ingredient for making third party content fast. It turns out nobody does dynamic loading the same way. I’d like to walk through some of the variations I found. It’s a story that touches on some of the most elegant and awful code out there, and is a commentary on the complexities of dealing with the DOM.
In early 2008 I started gathering techniques for loading scripts without blocking. I called the most popular technique the Script DOM Element approach. It’s pretty straightforward:
var domscript = document.createElement('script');
domscript.src = 'main.js';
document.getElementsByTagName('head')[0].appendChild(domscript);
I worked with the Google Analytics team on their async snippet. The first version that came out in December 2009 also used appendChild, but instead of trying to find the HEAD element, they used a different technique for finding the parent. It turns out that not all web pages have a HEAD tag, and not all browsers will create one when it’s missing.
var ga = document.createElement('script');
ga.src = ('https:' == document.location.protocol ?
    'https://ssl' : 'http://www') +
    '.google-analytics.com/ga.js';
ga.setAttribute('async', 'true');
document.documentElement.firstChild.appendChild(ga);
Google Analytics is used on an incredibly diverse set of web pages, so there was lots of feedback that identified issues with using documentElement.firstChild. In February 2010 they updated the snippet with this pattern:
var ga = document.createElement('script');
ga.type = 'text/javascript'; ga.async = true;
ga.src = ('https:' == document.location.protocol ?
    'https://ssl' : 'http://www') +
    '.google-analytics.com/ga.js';
var s = document.getElementsByTagName('script')[0];
s.parentNode.insertBefore(ga, s);
I think this is elegant. If we’re dynamically loading scripts, we’re doing that with JavaScript, so there must be at least one SCRIPT element in the page. The Google Analytics async snippet has just come out of beta, so this pattern must be pretty rock solid.
I wanted to see how other folks were loading dynamic scripts, so I took a look at YUI Loader. It has an insertBefore variable that is used for stylesheets, so for scripts it does appendChild to the HEAD element:
if (q.insertBefore) {
  var s = _get(q.insertBefore, id);
  if (s) {
    s.parentNode.insertBefore(n, s);
  }
} else {
  h.appendChild(n);
}
jQuery supports dynamic resource loading. Their code is very clean and elegant, and informative, too. In two pithy comments are pointers to bugs #2709 and #4378 which explain the issues with IE6 and appendChild.
head = document.getElementsByTagName ("head")[0] ||
    document.documentElement;
// Use insertBefore instead of appendChild to circumvent an IE6 bug.
// This arises when a base node is used (#2709 and #4378).
head.insertBefore(script, head.firstChild);
All of these implementations come from leading development teams, but what’s happening in other parts of the Web? Here’s a code snippet I came across while doing my P3PC Collective Media blog post:
var f=document.getElementsByTagName("script");
var b=f[f.length-1];
if(b==null){ return; }
var i=document.createElement("script");
i.language="javascript";
i.setAttribute("type","text/javascript");
var j="";
j+="document.write('
Collective Media starts out in a similar way by creating a SCRIPT element. Similar to Google Analytics, it gets a list of SCRIPT elements already in the page, and chooses the last one in the list. Then insertBefore is used to insert the new dynamic SCRIPT element into the document.
Normally, this is when the script would start downloading (asynchronously), but in this case the src hasn’t been set. Instead, the script’s URL has been put inside a string of JavaScript code that does a document.write of a SCRIPT HTML tag. (If you weren’t nervous before, you should be now.) (And there’s more.) Collective Media creates a global function called, of all things, appendChild. The dynamic SCRIPT element and string of document.write code are passed to this custom version of appendChild, which injects the string of code into the SCRIPT element, causing it to be executed. The end result, after all this work, is an external script that gets downloaded in a way that blocks the page. It’s not even asynchronous!
I’d love to see Collective Media clean up their code. They’re so close to making it asynchronous and improving the page load time of anyone who includes their ads. But really, doesn’t this entire blog post seem surreal? To be discussing this level of detail and optimization for something as simple as adding a script element dynamically is a testimony to the complexity and idiosyncrasies of the DOM.
In threads and discussions about adding simpler behavior to the browser, a common response I hear from browser developers is, “But site developers can do that now. We don’t have to add a new way of doing it.” Here we can see what happens without that simpler behavior. Hundreds, maybe even thousands of person hours are spent reinventing the wheel for some common task. And some dev teams end up down a bad path. That’s why I’ve proposed some clarifications to the ASYNC and DEFER attributes for scripts, and a new POSTONLOAD attribute.
I’m hopeful that HTML5 will include some simplifications for working with the DOM, especially when it comes to improving performance. Until then, if you’re loading scripts dynamically, I recommend using the latest Google Analytics pattern or the jQuery pattern. They’re the most bulletproof. And with the kinds of third party content I’ve seen out there, we need all the bulletproofing we can get.
Browser script loading roundup
How are browsers doing when it comes to parallel script loading?
Back in the days of IE7 and Firefox 2.0, no browser loaded scripts in parallel with other resources. Instead, these older browsers would block all subsequent resource requests until the script was received, parsed, and executed. Here’s how the HTTP requests look when this blocking occurs in older browsers:

The test page that generated this waterfall chart has six HTTP requests:
- the HTML document
- the 1st script – 2 seconds to download, 2 seconds to execute
- the 2nd script – 2 seconds to download, 2 seconds to execute
- an image – 1 second to download
- a stylesheet- 1 second to download
- an iframe – 1 second to download
The figure above shows how the scripts block each other and block the image, stylesheet, and iframe, as well. The image, stylesheet, and iframe download in parallel with each other, but not until the scripts are finished downloading sequentially.
The likely reason scripts were downloaded sequentially in older browsers was to preserve execution order. This is critical when code in the 2nd script depends on symbols defined in the 1st script. Preserving execution order avoids undefined symbol errors. But the missed opportunity is obvious – while the browser is downloading the first script and guaranteeing to execute it first, it could be downloading the other four resources in parallel.
Thankfully, newer browsers now load scripts in parallel!
This is a big win for today’s web apps that often contain 100K+ of JavaScript split across multiple files. Loading the same test page in IE8, Firefox 3.6, Chrome 4, and Safari 4 produces an HTTP waterfall chart like this:

Things look a lot better, but not as good as they should be. In this case, IE8 loads the two scripts and stylesheet in parallel, but the image and iframe are blocked. All of the newer browsers have similar limitations with regard to the extent to which they load scripts in parallel with other types of resources. This table from Browserscope shows where we are and the progress made to get to this point. The recently added “Compare” button added to Browserscope made it easy to generate this historical view.

While downloading scripts, IE8 still blocks on images and iframes. Chrome 4, Firefox 3.6, and Safari 4 block on iframes. Opera 10.10 blocks on all resource types. I’m confident parallel script loading will continue to improve based on the great progress made in the last batch of browsers. Let’s keep our eyes on the next browsers to see if things improve even more.
Crockford, webhosting, online dating, JSON, alert
This is a fun story that has a security and performance point to it.
Earlier today, Dion Almaer tweeted:
Wow, Doug added an alert() to http://www.json.org/json2.js which just alerted a LOT of people on the Internet. Proving a point on hotlinks?
I was talking to Doug about his keynote at Add-on-Con tomorrow, and asked him what the motivation was for this alert message. It turns out his webhosting service had contacted him about the unusually high amount of traffic on json.org. Doug investigated and discovered that OnlineBootyCall was linking directly to http://json.org/json.js, in spite of this statement in the file:
USE YOUR OWN COPY. IT IS EXTREMELY UNWISE TO LOAD CODE FROM SERVERS YOU DO NOT CONTROL.
Linking directly to http://json.org/json.js is bad. Certainly, it puts a load on Doug’s webhosting company that shouldn’t be there. But more importantly, it exposes the content site to security and performance vulnerabilities. Loading third party scripts into the parent window gives that third party access to cookies and other potentially confidential information in the page. Accessing that script from a third party domain requires an additional DNS lookup (which can be costly). Also, if the script is at the top of the page (which it is in this case) and the third party site is slow or not responding, the entire page is left blank for thirty seconds or more.
It’s best to reduce the number of third party scripts on your site. That was the reason Doug added the alert message to the top of json.js. If you haven’t gone to OnlineBootyCall yet today, here’s what you would’ve seen:

In Doug’s words,
I’m helping onlinebootycall improve its performance.
Speed Tracer – visibility into the browser
Is it just me, or does anyone else think Google’s on fire lately, lighting up the world of web performance? Quick review of news from the past two weeks:
- timeline and heap profiler added to Chrome Dev Tools
- Google Analytics publishes async script loading pattern
- latency and Page Speed recommendations added to Webmaster Tools
- deep dive into what makes Chrome (and browsers in general) fast
- Google Public DNS launched
- and now… the release of Speed Tracer
Speed Tracer was my highlight from last night’s Google Campfire One. The event celebrated the release of GWT 2.0. Performance and “faster” were emphasized again and again throughout the evening’s presentations (I love that). GWT’s new code splitting capabilities are great for performance, but Speed Tracer easily wowed the audience – including me. In this post, I’ll describe what I like about Speed Tracer, what I hope to see added next, and then I’ll step back and talk about the state of performance profilers.
Getting started with Speed Tracer
Some quick notes about Speed Tracer:
- It’s a Chrome extension, so it only runs in Chrome. (Chrome extensions is yet another announcement this week.)
- It’s written in GWT 2.0.
- It works on all web sites, even sites that don’t use GWT.
The Speed Tracer getting started page provides the details for installation. You have to be on the Chrome dev channel. Installing Speed Tracer adds a green stopwatch to the toolbar. Clicking on the icon starts Speed Tracer in a separate Chrome window. As you surf sites in the original window, the performance information is shown in the Speed Tracer window.

Beautiful visibility
When it comes to optimizing performance, developers have long been working in the dark. Without the ability to measure JavaScript execution, page layout, reflows, and HTML parsing, it’s not possible to optimize the pain points of today’s web apps. Speed Tracer gives developers visibility into these parts of page loading via the Sluggishness view, as shown here. (Click on the figure to see a full screen view.) Not only is this kind of visibility great, but the display is just, well, beautiful. Good UI and dev tools don’t often intersect, but when they do it makes development that much easier and more enjoyable.

Speed Tracer also has a Network view, with the requisite waterfall chart of HTTP requests. Performance hints are built into the tool flagging issues such as bad cache headers, exceedingly long responses, Mozilla cache hash collision, too many reflows, and uncompressed responses. Speed Tracer also supports saving and reloading the profiled information. This is extremely useful when working on bugs or analyzing performance with other team members.
Feature requests
I’m definitely going to be using Speed Tracer. For a first version, it’s extremely feature rich and robust. There are a few enhancements that will make it even stronger:
- overall pie chart – The “breakdown by time” for phases like script evaluation and layout are available for segments within a page load. As a starting point, I’d like to see the breakdown for the entire page. When drilling down on a specific load segment, this detail is great. But having overall stats will give developers a clue where they should focus most of their attention.
- network timing – Similar to the issues I discovered in Firebug Net Panel, long-executing JavaScript in the main page blocks the network monitor from accurately measuring the duration of HTTP requests. This will likely require changes to WebKit to record event times in the events themselves, as was done in the fix for Firefox.
- .HAR support – Being able to save Speed Tracer’s data to file and share it is great. Recently, Firebug, HttpWatch, and DebugBar have all launched support for the HTTP Archive file format I helped create. The format is extensible, so I hope to see Speed Tracer support the .HAR file format soon. Being able to share performance information across tools and browsers is a necessary next step. That’s a good segue…
Developers need more
Three years ago, there was only one tool for profiling web pages: Firebug. Developers love working in Firefox, but sometimes you just have to profile in Internet Explorer. Luckily, over the last year we’ve seen some good profilers come out for IE including MSFast , AOL Pagetest, WebPagetest.org, and dynaTrace Ajax Edition. DynaTrace’s tool is the most recent addition, and has great visibility similar to Speed Tracer, as well as JavaScript debugging capabilities. There have been great enhancements to Web Inspector, and the Chrome team has built on top of that adding timeline and memory profiling to Chrome. And now Speed Tracer is out and bubbling to the top of the heap.
The obvious question is:
Which tool should a developer choose?
But the more important question is:
Why should a developer have to choose?
There are eight performance profilers listed here. None of them work in more than a single browser. I realize web developers are exceedingly intelligent and hardworking, but no one enjoys having to use two different tools for the same task. But that’s exactly what developers are being asked to do. To be a good developer, you have to be profiling your web site in multiple browsers. By definition, that means you have to install, learn, and update multiple tools. In addition, there are numerous quirks to keep in mind when going from one tool to another. And the features offered are not consistent across tools. It’s a real challenge to verify that your web app performs well across the major browsers. When pressed, rock star web developers I ask admit they only use one or two profilers – it’s just too hard to stay on top of a separate tool for each browser.
This week at Add-on-Con, Doug Crockford’s closing keynote is about the Future of the Web Browser. He’s assembled a panel of representatives from Chrome, Opera, Firefox, and IE. (Safari declined to attend.) My hope is they’ll discuss the need for a cross-browser extension model. There’s been progress in building protocols to support remote debugging: WebDebugProtocol and Crossfire in Firefox, Scope in Opera, and ChromeDevTools in Chrome. My hope for 2010 is that we see cross-browser convergence on standards for extensions and remote debugging, so that developers will have a slightly easier path for ensuring their apps are high performance on all browsers.