Velocity highlights (video bonus!)
We’re in the quiet period between Velocity Santa Clara and Velocity New York. It’s a good time to look back at what we saw and look forward to what we’ll see this September 15-17 in NYC.
Velocity Santa Clara was our biggest show to date. There was more activity across the attendees, exhibitors, and sponsors than I’d experienced at any previous Velocity. A primary measure of Velocity is the quality of the speakers. As always, the keynotes were livestreamed. The people who tuned in were not disappointed. I recommend reviewing all of the keynotes from the Velocity YouTube Playlist. All of them were great, but here were some of my favorites:
 |
Virtual Machines, JavaScript and Assembler – Start. Here. Scott Hanselman’s walk through the evolution of the Web and cloud computing is informative and hilarious. |
 |
Lowering the Barrier to Programming – Pamela Fox works on the computer programming curriculum at Khan Academy. She also devotes time to Girl Develop It. This puts her in a good position to speak about the growing gap between the number of programmers and the number of programmer jobs, and how bringing more diversity into programming is necessary to close this gap. |
 |
Achieving Rapid Response Times in Large Online Services – Jeff Dean, Senior Fellow at Google, shares amazing techniques developed at Google for fast, scalable web services. |
 |
Mobile Web at Etsy – People who know Lara Swanson know the incredible work she’s done at Etsy building out their mobile platform. But it’s not all about technology. For a company to be successful it’s important to get cultural buy-in. Lara explains how Etsy achieved both the cultural and technical advances to tackle the challenges of mobile. |
 |
Build on a Bedrock of Failure – I want to end with this motivational cross-disciplinary talk from skateboarding icon Rodney Mullen. When you’re on the bleeding edge (such as skateboarding or devops), dealing with failure is a critical skill. Rodney talks about why people put themselves in this position, how they recover, and what they go on to achieve. |
Now for the bonus! Some speakers have posted the videos of their afternoon sessions. These are longer, deeper talks on various topics. Luckily, some of the best sessions are available on YouTube:
 |
Is TLS Fast Yet? – If you know performance then you know Ilya Grigorik. And if you know SPDY, HTTP/2, privacy, and security you know TLS is important. Here, the author of High Performance Browser Networking talks about how fast TLS is and what we can do to make it faster. |
 |
GPU and Web UI Performance: Building an Endless 60fps Scroller – Whoa! Whoa whoa whoa! Math?! You might not have signed up for it, but Diego Ferreiro takes us through the math and physics for smooth scrolling at 60 frames-per-second and his launch of ScrollerJS. |
 |
WebPagetest Power Users Part 1 and Part 2 – WebPagetest is one of the best performance tools out there. Pat Meenan, creator of WebPagetest, guides us through the new and advanced features. |
 |
Smooth Animation on Mobile Web, From Kinetic Scrolling to Cover Flow Effect – Ariya Hidayat does a deep dive into the best practices for smooth scrolling on mobile. |
 |
Encouraging Girls in IT: A How To Guide -Â Doug Ireton and his 7-year-old daughter, Jane Ireton, lament the lack of women represented in computer science and Jane’s adventure learning programming. |
If you enjoy catching up using video, I recommend you watch these and other videos from the playlist. If you’re more of the “in-person” type, then I recommend you register for Velocity New York now. While you’re there, use my STEVE25 discount code for 25% off. I hope to see you in New York!
HTTP Archive – new stuff!
Background
The HTTP Archive crawls the world’s top 300K URLs twice each month and records detailed information like the number of HTTP requests, the most popular image formats, and the use of gzip compression. We also crawl the top 5K URLs on real iPhones as part of the HTTP Archive Mobile. In addition to aggregate stats, the HTTP Archive has the same set of data for individual websites plus images and video of the site loading.
I started the project in 2010 and merged it into the Internet Archive in 2011. The data is collected using WebPagetest. The code and data are open source. The hardware, mobile devices, storage, and bandwidth are funded by our generous sponsors:  Google, Mozilla, New Relic, O’Reilly Media, Etsy, Radware, dynaTrace Software, Torbit, Instart Logic, and Catchpoint Systems.
For more information about the HTTP Archive see our About page.
New Stuff!
I’ve made a lot of progress on the HTTP Archive in the last two months and want to share the news in this blog post.
- Github
- A major change was moving the code to Github. It used to be on Google Code but Github is more popular now. There have been several contributors over the years, but I hope the move to Github increases the number of patches contributed to the project.
- Histograms
- The HTTP Archive’s trending charts show the average value of various stats over time. These are great for spotting performance regressions and other changes in the Web. But often it’s important to look beyond the average and see more detail about the distribution. As of today all the relevant trending charts have a corresponding histogram. For an example, take a look at the trending chart for Total Transfer Size & Total Requests and its corresponding histograms. I’d appreciate feedback on these histograms. In some cases I wonder if a CDF would be more appropriate.
- Connections
- We now plot the number of TCP connections that were used to load the website. (All desktop stats are gathered using IE9.) Currently the average is 37 connections per page.
 Â
 - CDNs
- We now record the CDN, if any, for each individual resource. This is currently visible in the CDNs section for individual websites. The determination is based on a reverse lookup of the IP address and a host-to-CDN mapping in WebPagetest.
Custom Metrics
Pat Meenan, the creator of WebPagetest, just added a new feature called custom metrics for gathering additional metrics using JavaScript. The HTTP Archive uses this feature to gather these additional stats:
- Average DOM Depth
- The complexity of the DOM hierarchy affects JavaScript, CSS, and rendering performance. I first saw average DOM depth as a performance metric in DOM Monster. I think it’s a good stat for tracking DOM complexity.
 Â
 - Document Height
- Web pages are growing in many ways such as total size and use of fonts. I’ve noticed pages also getting wider and taller so HTTP Archive now tracks document height and width. You can see the code here. Document width is more constrained by the viewport of the test agent and the results aren’t that interesting, so I only show document height.
 Â
 - localStorage & sessionStorage
- The use of localStorage and sessionStorage can help performance and offline apps, so the HTTP Archive tracks both of these. Right now the 95th percentile is under 200 characters for both, but watch these charts over the next year. I expect we’ll see some growth.
- Iframes
- Iframes are used frequently to contain third party content. This will be another good trend to watch.

- SCRIPT Tags
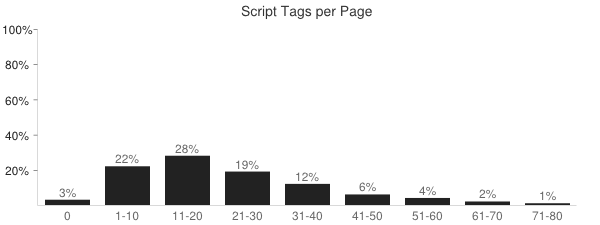
- The HTTP Archive has tracked the number of external scripts since its inception, but custom metrics allows us to track the total number of SCRIPT tags (inline and external) in the page.
- Doctype
- Specifying a doctype affects quirks mode and other behavior of the page. Based on the latest crawl, 14% of websites don’t specify a doctype, and “html” is the most popular doctype at 40%. Here are the top five doctypes.
Doctype Percentage html40% html -//W3C//DTD XHTML 1.0 Transitional//EN http://www.w3.org/TR/xhtml1/DTD/xhtml1-transitional.dtd31% [none] 14% html -//W3C//DTD XHTML 1.0 Strict//EN http://www.w3.org/TR/xhtml1/DTD/xhtml1-strict.dtd8% HTML -//W3C//DTD HTML 4.01 Transitional//EN http://www.w3.org/TR/html4/loose.dtd3%
Some of these new metrics are not yet available in the HTTP Archive Mobile but we’re working to add those soon. They’re available as histograms currently, but once we have a few months of data I’ll add trending charts, as well.
What’s next?
Big ticket items on the HTTP Archive TODO list include:
- easier private instance – I estimate there are 20 private instances of HTTP Archive out there today (see here, here, here, here, and here). I applaud these folks because the code and documentation don’t make it easy to setup a private instance. There are thousands of WebPagetest private instances in the world. I feel that anyone running WebPagetest on a regular basis would benefit from storing and viewing the results in HTTP Archive. I’d like to lower the bar to make this happen.
- 1,000,000 URLs – We’ve increased from 1K URLs at the beginning four years ago to 300K URLs today. I’d like to increase that to 1 million URLs on desktop. I also want to increase the coverage on mobile, but that’s going to probably require switching to emulators.
- UI overhaul – The UI needs an update, especially the charts.
In the meantime, I encourage you to take a look at the HTTP Archive. Search for your website to see its performance history. If it’s not there (because it’s not in the top 300K) then add your website to the crawl. And if you have your own questions you’d like answered then try using the HTTP Archive dumps that Ilya Grigorik has exported to Google BigQuery and the examples from bigqueri.es.
Unexpected prerender in Chrome
Over the last week I’ve been investigating the cacheability of resources from Shopify. I would visit the page every few hours and track the number of 200 OK versus 304 Not Modified responses. To my surprise, Chrome’s Network tab indicated that almost all the responses were “from cache”.
This didn’t make sense. In many cases the resource URLs changed between test loads. How could a never-before-seen URL be “from cache”? In cases where the URL was the same, I noticed that the Date response header had changed from the previous test but Chrome still marked it “from cache”. How could the Date change without a 200 response status code?
I started thinking about my “Prebrowsing” work (blog post, slides, video). In my findings I talk about how browsers, especially Chrome, are doing more work in anticipation of what the user needs next. This proactive work includes doing DNS lookups, establishing TCP connections, downloading resources, and even prerendering entire pages.
Was it possible that Chrome was prerendering the entire page?
I started by looking at chrome://predictors. Given characters entered into Omnibox (the location field), this shows which URL you’re predicted to go to. In my tests, I had always typed the URL into the location bar, so the predictions for “shopify” could affect Chrome’s behavior in my tests. Here’s what I found in chrome://predictors:

Chrome predicted that if I entered “www.s” into the Omnibox I would end up going to “http://www.shopify.com/” with confidence 1.0 (as shown in the rightmost column). In fact, just typing “ww” had a 0.9 confidence of ending up on Shopify. In other words, Chrome had developed a deep history mapping my Omnibox keystrokes to the Shopify website, as indicated by rows colored green.
From my Prebrowsing research I knew that if the chrome://predictors confidence was high enough, Chrome would pre-resolve DNS and pre-connect TCP. Perhaps it was possible that Chrome was also proactively sending HTTP requests before they were actually needed. To answer this I opened Chrome’s Net panel and typed “www.s” in the Omnibox but never hit return. Instead, I just sat there and waited 10 seconds. But nothing showed up in Chrome’s Net panel:

Suspecting that these background requests might not show up in Net panel, I fired up tcpdump and repeated the test – again only typing “www.s” and NOT hitting return. I uploaded the pcap file to CloudShark and saw 86 HTTP requests!

I looked at individual requests and saw that they were new URLs that had never been seen before but were in the HTML document. This confirmed that Chrome was prerendering the HTML document (as opposed to prefetching individual resources based on prior history). I was surprised that no one had discovered this before, so I went back to High Performance Networking in Google Chrome by Ilya Grigorik and scanned the Omnibox section:
the yellow and green colors for the likely candidates are also important signals for the ResourceDispatcher! If we have a likely candidate (yellow), Chrome may trigger a DNS pre-fetch for the target host. If we have a high confidence candidate (green), then Chrome may also trigger a TCP pre-connect once the hostname has been resolved. And finally, if both complete while the user is still deliberating, then Chrome may even pre-render the entire page in a hidden tab.
Takeaways
What started off as a quick performance analysis turned into a multi-day puzzler. The puzzle’s solution yields a few takeaways:
- Remember that Chrome may do DNS prefetch, TCP pre-connect, and even prerender the entire page based on the confidences in chrome://predictors.
- Not all HTTP requests related to a page or tab are shown in Chrome’s Net panel. I’d like to see this fixed, perhaps with an option to show these behind-the-scenes requests.
- Ilya knows everything. Re-read his posts, articles, and book before running multi-day experiments.
Browser Wishlist 2013
This is a cross-post from last month’s Performance Calendar (hence the reference to “holiday” spirit).
In case any browser teams are awash in the spirit of holiday gift-giving, here’s my wishlist for performance features I’d love to see. I did a similar Browser Performance Wishlist in 2010. I hope this list will initiate numerous discussions that result in a faster browsing experience for everyone.
- async 3rd party content (especially ads)
The amount of 3rd party content on websites continues to grow.* Websites need a way to load this content without having it delay the 1st party content on the page. Iframes are a possible solution, but there are various issues including fixed sizing. Many 3rd party content providers provide async snippets, but this is the exception rather than the rule.
Perhaps the most popular 3rd party content on the Web is ads, where asynchronous snippets are almost unheard of. Asynchronous loading is more complex for ads because they often use document.write. We need a way to load 3rd party content, including ads, asynchronously even when there’s a possibility of document.write being used. HTML imports are a possible solution depending on the final implementation and the need for workarounds.
* This is based on data such as the 50% increase in the number of domains per page and the increase in estimated amount of third party content from 32% to 38% over the previous two years. It would be great if someone used the HTTP Archive data to more precisely quantify this. The hard part is defining “3rd party content” in SQL.
- async document.write
Another approach to enable loading scripts asynchronously would be if browsers supported an async version of document.write. Currently, if document.write occurs in an asynchronous script the best case is the document.write is ignored. The worst case is the entire page is erased and replaced with just the output from document.write. (See this test page.)
It would be better if browsers instead inserted the output from document.write right below the associated SCRIPT tag. The implementation is much more complex that I make it sound. In fact, Opera used to have a Delayed Script Execution option that was able to do this but it’s no longer available.
- Preferred Caching
There’s a long tail to Internet browsing, but users also have favorite websites that they visit every day. To increase the probability of those sites loading faster, browsers should more aggressively cache the resources associated with these favorite websites. Websites could be deemed “favorite” manually by the user as well as automatically based on browsing history. (See related blog post.)
- Prefresh
“Prefresh” is a concept Tony Gentilcore and I came up with to make websites load faster by proactively downloading and updating critical resources before they’re needed. The determination of what to prefresh is based on prior activity. This is currently an experimental feature in Chrome. (See related blog post.) I’d like to see the code finished in Chrome and, based on results, adopted by other browsers.
- responsive images (Client Hints)
Responsive images is a complex issue with multiple candidate solutions. (See Bruce Lawson’s Responsive images – end of year report.) All of the proposals have pros and cons. The issue has been discussed for more than a year. It’s important for browsers to pick the preferred solution. I wish Client Hints was supported. It doesn’t solve all the problems, but I think it’s a lightweight solution that works in most cases, especially since CDNs can automate the process for website owners.
- more RUM (rendering, fps, GC, etc.)
The W3C Web Performance Working Group has made incredible progress with the Navigation Timing, Resource Timing, and User Timing specifications. (Except on Safari as mentioned earlier.) These APIs allow us to measure performance where it matters the most: on real users. But the performance we’re able to measure is more about the mechanics of the page and less about the user experience and what’s going on behind the scenes.
I’d like JavaScript access to information about rendering, garbage collection, frames per second, memory use, and JavaScript execution. Much of this is available today in browser dev tools. The big work seems to be defining what to measure in a way that can be standardized across browsers while not slowing down the user experience, making that accessible via JavaScript, and adding it to preferred RUM solutions and dashboards.
- smarter font loading
The number of Top 1000 websites that use custom fonts has increased from 13% to 35% in the last year (according to the HTTP Archive). The use of custom fonts is increasing rapidly. Unfortunately, custom fonts can make websites render more slowly and have Flash of Unstyled Content (FOUC) issues. These issues would be mitigated if browsers loaded fonts with some special handling:
- Browser preloaders (AKA speculative parsers and lookahead parsers) should start downloading fonts sooner. The Font Priority test page shows this does not happen today. The test page has a @font-face rule that is defined in a STYLE block in the HEAD. That font is used by the H3 element at the top of the page, which is followed by 18 images. The font and images are all on the same domain. It’s more important to download the font than the images, but all the major browsers download 6-8 images before downloading the font. That’s because the preloader sees the IMG tags and starts downloading those images first. Eventually it parses the H3 element and determines the font is needed and queues it up for the second round of downloads. It would be better if the preloader was extended to scan ahead for the definition of as well as the use of @font-face styles.
- Browsers should avoid Flash of Unstyled Text and blank elements by waiting a very short amount of time (300-500 ms) for the custom font to download. If the custom font hasn’t arrived by that time then the element should be rendered in a default font and should not be repainted if/when the custom font finally downloads. The selection of a time value is a hard decision; I lean toward a short timeout. Current behavior varies widely across major browsers. The @font-face FOUT test page shows that Chrome, Opera, and Safari leave the element blank until the font is fully downloaded. Firefox leaves it blank for ~3 seconds (too late) at which point it draws the element in a default font, and then redraws it when the custom font arrives (FOUT). IE10 draws the text immediately using a default font (too early) and then redraws it later (FOUT). Checkout Typekit’s asynchronous embed code and WebFont Loader to see how to achieve your desired behavior today. (Hint: inline your font as a data: URI inside a stylesheet.)
- Developers should be able to specify how font loading and rendering behaves. It’s going to be hard to pick a default behavior and timeout value that pleases everyone. The question are:
- Should the element be blank until the font file arrives, or should it be rendered with a default font?
- If it’s rendered with a default font, when should that happen (immediately or after a delay)?
- If it’s rendered with a default font after a delay, should it be repainted when the custom font arrives?
The Resource Priorities spec helps by defining the “resource-priorities” CSS property which can take values of “lazyload” and “postpone”, but the rendering behavior in the presence of this property isn’t specified. I propose that if “lazyload” or “postpone” is used with @font-face, then the browser should immediately render the element with a default font and it should be repainted when the font file arrives. If neither “lazyload” nor “postpone” is specified, then the element should be blank until the font file arrives or the request times out. (Note that CSS Font Load Events provides a way to do much of this programmatically.)
- Font files should be given a high priority in the browser cache. I.e., images and video should be purged from the cache before custom font files. It’s possible this is already the case – I don’t have an easy way to test this.
- Browsers should re-use expired fonts with a stale-while-revalidate policy by default. If a font file is in the cache but is expired, browsers should reuse it immediately while doing the conditional GET request in the background. This is similar to the behavior proposed for the stale-while-revalidate Cache-Control extension.
- anchor PING support
The HTML5 PING attribute for anchors is great for performance. Google Search on mobile got users to their favorite search result website 200-400 ms faster by switching from redirects to A PING. Right now A PING is only supported in Chrome and Safari. We need broader browser support.
- DEFER for inline scripts
Downloading external scripts so they don’t block the HTML parser is good. The main ways to do that today are the ASYNC and DEFER attributes. Many sites have multiple scripts with a dependency order. These sites can’t use ASYNC since that executes scripts in a non-deterministic order. Therefore, DEFER is the method of choice for interdependent external scripts. But these sites also typically have inline scripts that rely on the symbols from those external scripts. Currently, there’s no way in markup to declare that dependency.
Adding support for DEFER for inline scripts would solve this problem, but it’s currently only supported for external scripts. If it was supported for inline scripts, developers could ensure proper execution order by adding DEFER to all the relevant inline and external SCRIPT tags.
Personally, I’d prefer to see support for John Resig’s Degrading Script Tags pattern – it puts the dependent inline code within the external script’s SCRIPT block, like so:
<script src="main.js">
functionDefinedInMainJs();
</script>
The beauty of this technique is
functionDefinedInMainJsisn’t called ifmain.jsfails to load. This avoids undefined symbol errors in these failure scenarios. - lookahead for @import
Browsers use a preloader (AKA lookahead parser or speculative parser) to accelerate resource downloads while the main parser is blocked downloading scripts. The preloader does pretty well with typical resource downloads: SCRIPT, LINK, IMG, and IFRAME. But the preloader logic should be improved to accelerate the downloading of stylesheets specified with @import.
The @import Priority test page shows that the preloader in Firefox and IE 9, 10 & 11 doesn’t recognize “@import” and instead loads a bunch of images ahead of the stylesheet (even though the stylesheet is in the HEAD and the images are later in the BODY).
Another optimization for @import would be if browsers speculatively parsed the first few lines of a “main” stylesheet to see if it references any “sub” stylesheets using “@import”. If so, the browser should start downloading these “sub” stylesheets immediately without waiting for the entire “main” stylesheet to finish downloading. Fortunately, browsers only have to look at the first few lines because the CSS spec dictates that all @imports “must precede all other at-rules and style rules in a style sheet”. Unfortunately, the link with BIG @import test page shows that all major browsers wait until the entire stylesheet is downloaded before downloading an @import’ed stylesheet. Improving the browser preloader to scan stylesheets for “@import” would speedup page rendering, especially on mobile.
- UX for perception of speed
I wish browsers would invest more time in promoting a perception of speed into the browser UI. I’ve spoken about the perception of speed (video, slides). Some of the techniques are more relevant for web developers, but many ideas are targeted at browsers and thus would benefit every website. Examples include improving the browser busy indicators, clearing the page, and “natural” progress indicators.
- improved web components
I’m optimistic about the future of Web Components, but I made some suggestions in a recent series of blog posts: Async Ads with HTML Imports, Performance of Custom Elements, and HTML Imports: scope, security, and suggestions. As we specify and implement new web features it’d be good if we focused on performance to ensure a faster future on the Web.
HTML Imports: scope, security, and suggestions
This is the third of three blog posts on Web Components, primarily focusing on the performance impact of HTML imports.
Scope
The first post, Async Ads with HTML Imports, proposes using this new technology as a way to avoid the blocking behavior of synchronous ads. It’s better than using iframes because the HTML import’s LINK tag can be placed in HEAD so that the ads show up more quickly resulting in higher ad revenue.
One downside is that many ads use document.write and this erases the entire page when wrapped inside an HTML import. This is surprising for folks who know that document.write works fine within an iframe. Why shouldn’t it work just as well within an HTML import? After all, HTML imports are separate documents just like iframes. The first line of the spec confirms this:
HTML Imports, or just imports from here on, are HTML documents…
And the interface clearly shows that a document is created to contain the content:
interface Import {
    readonly attribute DOMString? href;
    readonly attribute Node ownerNode;
    readonly attribute Document content;
};
It turns out the issue is because when JavaScript in the HTML import references the “document” variable, it does NOT refer to the HTML import’s document. Instead, it refers to the main page’s document. In other words, the HTML import’s JavaScript is executed in the scope of the main page’s document, not in the scope of its own document.
Jonas Sicking (Mozilla) started a thread with the topic what scope to run in that discusses this issue. The suggested solution is to recommend that HTML imports use the MODULE tag rather than SCRIPT tags. There’s more discussion of module loaders and module namespace collision. To me the bigger issue is that, despite this recommendation, HTML imports will still have SCRIPT tags, and that JavaScript will execute in a context that is likely to be counterintuitive to developers.
It would be better if JavaScript within an HTML import was executed in the context of the HTML import’s document. The HTML import’s JavaScript could still reach the parent window’s namespace, for example, window.parent.document. Although, it would be nice if the website owner could control this access, which leads us to security.
Security
I believe Web Components will become popular as a way to reuse 3rd party widgets, but this introduces a security risk where 3rd parties might peruse information that’s confidential to the website and its users, such as cookies.
I noticed that the spec said HTML imports must be CORS-enabled. At first I thought this was to address the issue of 3rd party HTML imports accessing privileged information in the main page. But on further reading I realized it’s the other way around: the purpose is to provide a way for the HTML Import to allow the main page to access the content inside the imported document.
I created some test pages to confirm this behavior. The HTML import in the Custom Element example is CORS-enabled by adding this response header to the HTML import:
Access-Control-Allow-Origin: *
The Custom Element no CORS test page has that header removed and thus the HTML import fails. While this correctly protects the 3rd party content from being exposed to the main website, it’s important for the adoption of HTML imports to provide a means of security in the other direction. Iframes address this issue with the HTML5 sandbox attribute. I’d like to see something similar added for HTML imports.
Suggestions
These last three blog posts have talked about the performance, rendering, and JavaScript issues I found with regard to Web Components. I’d like to wrap it up by providing a list of my suggestions for Web Components:
- Add a “lazyload” attribute to
<link rel="import" ...>. This allows for faster page rendering. This might be addressed by the Resource Priorities spec, but the desired behavior needs to be implemented where HTML imports do not block rendering when a SCRIPT tag is encountered. - Add an “elements” attribute toÂ
<link rel="import" ...>. This provides a way to avoid FOUC for custom elements while allowing prior DOM elements to render. Daniel Buchner and I proposed this on the W3C public-webapps mailing list. - Make
<link rel="import" ...>valid inside BODY. Right now they’re only valid inside HEAD. It’s better if the HTML import’s LINK tag is placed in the BODY where the content is to be imported because:- It eliminates the possibility of the SCRIPT tag blocking rendering of the entire page while ALSO providing a way to make certain types of HTML imports synchronous (block rendering until the import is ready) thus avoiding FOUC.
- It makes it easier for new developers to understand the semantics of the page’s construction by having all the parts of the Web Component located next to each other.
- Make JavaScript inside an HTML import execute in the import’s document context. This is likely more intuitive for developers and provides more portability for existing JavaScript migrated to be an HTML import.
- Add a “sandbox” attribute toÂ
<link rel="import" ...>. This allows website owners to include 3rd party content while preventing those unknown sources from accessing confidential information on the page (such as cookies).
3rd party content is a performance issue that gets worse every year. I’m excited about the potential of Web Components as the specification and implementations grow to address the needs of web developers and website owners.
Performance and Custom Elements
This past week I dug into the performance of custom elements and found some surprises.
In my previous blog post, Async Ads with HTML Imports, I complained that HTML imports block the page from rendering when a SCRIPT tag is found and lamented the fact that the spec doesn’t provide a mechanism to make this coupling asynchronous. Custom elements are just the opposite: they’re asynchronous by default and the spec doesn’t provide a way to make them synchronous.
Cake and eat it too
It’s important to understand why we need both synchronous AND asynchronous mechanisms for loading content.
- Sometimes content is so critical to the page it should be rendered before anything else. In these situations it’s necessary to load the content synchronously in order to achieve the user experience desired by the website owner and designers. Synchronous loading is also necessary in other situations such as when there are dependencies between resources (e.g., interdependent scripts) and to avoid jarring changes in page layout (also known as Flash of Unstyled Content or FOUC).
- Other times, the content coming from sub-resources in the page is secondary to the main page’s content and developers & designers prefer to load it asynchronously. This is a newer pattern in web development. (I like to think I had something to do with it becoming popular.) Loading these less critical resources asynchronously produces a better user experience in terms of faster loading and rendering.
The bottomline is there are situations that call for both behaviors and developers need a way to achieve the user experience they deem appropriate. The main role for specs and browsers is to provide both mechanisms and choose a good default. We didn’t do that in the previous versions of HTML and are trying to fill that gap now with the Resource Priorities spec which adds the lazyload attribute to various tags including IMG, SCRIPT, and LINK. We don’t want to repeat this gap-filling-after-the-fact process in the future, so we need to provide sync and async capabilities to the HTML5 features being spec’ed now – and that includes Web Components.
Custom Elements howto
Note that right now the only browser I found that supports Web Components is Chrome Canary – so you’ll need to install that to play with the examples. I turned on the following flags in chrome://flags/: Experimental Web Platform features, Experimental JavaScript, and HTML Imports.
The way to define a custom element is in JavaScript. Here’s the custom element used in my examples. It creates a new custom element called x-foo:
var XFooProto = Object.create(HTMLElement.prototype);

XFooProto.createdCallback = function() {
    this.innerHTML = '<div id="imported-content" style="background: #E99; border: 2px; font-size: 2em; text-align: center; padding: 8px; height: 100px;">CUSTOM ELEMENT</div>';
};

var XFoo = document.register('x-foo', {prototype: XFooProto});
To make custom elements more reusable they’re wrapped inside an HTML import:
<link rel="import" href="import-custom-element.php">
In the HTML document we can use the custom element just like any other HTML tag:
<x-foo></x-foo>
Experienced developers recognize that this creates a race condition: what happens if the x-foo tag gets parsed before import-custom-element.php is done downloading?
(async) Custom Elements = FOUC
The first example, custom-element.php, demonstrates the typical custom element implementation described above. If you load it (in Chrome Canary) you’ll see that there’s a Flash of Unstyled Content (FOUC). This reveals that browsers handle custom elements asynchronously: the HTML import starts downloading but the browser continues to parse the page. When it reaches the x-foo tag it skips over it as an unrecognized element and renders the rest of the page. When the HTML import finishes loading the browser backfills x-foo which causes the page’s content to jump down ~100 pixels – a jarring FOUC experience.
This is great for faster rendering! I love that the default is async. And there are certainly scenarios when this wouldn’t created FOUC (custom elements that aren’t visible or will be used later) or the FOUC isn’t so jarring (below-the-fold, changes style but not layout). But in cases like this one where the FOUC is undesirable, there needs to be a way to avoid this disruptive change in layout. Sadly, the spec doesn’t provide a way of doing this. Let’s look at two possible workarounds.
Sized Custom Elements
The jarring change in layout can be avoided if the main page reserves space for the custom element. This is done in the custom-element-sized.php example like this:
<div style="height: 120px;">
<x-foo></x-foo>
</div>
The custom element is inside a fixed size container. As shown by this example, the existing page content is rendered immediately and when the HTML import finally finishes downloading the custom element is backfilled without a change in layout. We’ve achieved the best of both worlds!
The drawback to this approach is it only works for custom elements that have a fixed, predefined size. That condition might hold for some custom elements, but certainly not for all of them.
Sync Custom Elements
The custom-element-sync.php example shows a workaround to avoid FOUC for custom elements that have an unknown size. Unfortunately, this technique blocks rendering for everything in the page that occurs below the custom element. The workaround is to add a SCRIPT tag right above the custom element, for example:
<script>
var foo=128;
</script>
<x-foo></x-foo>
As shown in my previous post, HTML imports cause the parser to stop at the first SCRIPT tag that is encountered. There is a slight benefit here of making sure the only SCRIPT tag after the <link rel="import"...> is right before the custom element – this allows the content above the custom element to render without being blocked. You can see this in action in the example – only the content below the custom element is blocked from rendering until the HTML import finishes loading.
By blocking everything below the custom element we’ve avoided the FOUC issue, but the cost is high. Blocking this much content can be a bad user experience depending on the main page’s content. Certainly if the custom element occupied the entire above-the-fold area (e.g., on a mobile device) then this would be a viable alternative.
It would be better if the spec for custom elements included a way to make them synchronous. One solution proposed by Daniel Buchner and me to W3 Public Webapps is to add an attribute called “elements” to HTML imports:
<link rel="import" href="elements.html" elements="x-carousel, x-button">
The “elements” attribute is a list of the custom elements that should be loaded synchronously. (In other words, it’s NOT the list of all custom elements in the HTML import – only the ones that should cause rendering to be blocked.) As the browser parses the page it would skip over all custom elements just as it does now, unless it encounters a custom element that is listed in the “elements” attribute value (e.g., “x-carousel” and “x-button”). If one of the listed custom elements is reached, the parser would block until either the custom element becomes defined or all outstanding HTML import requests are done loading.
Tired of hacks
I love finding ways to make things work the way I want them to, but it’s wrong to resort to hacks for these new HTML5 features to achieve basic behavior like avoiding FOUC and asynchronously loading. Luckily, the specs and implementations are in early stages. Perhaps there’s still time to get them changed. An important part of that is hearing from the web development community. If you have preferences and use cases for HTML imports and custom elements, please weigh in. A little effort today will result in a better Web tomorrow.
Many thanks to the authors for these fantastic articles on Web Components:
Async Ads with HTML Imports
Scripts loaded in the typical way (<script src="a.js"></script>) block rendering which is bad for performance. The solution to this problem is to load scripts asynchronously. This is the technique used by the best 3rd party snippets, for example, Google Analytics, Tweet button, Facebook SDK, and Google+ Follow button.
Ads are probably the most prevalent 3rd party content on the Web. Unfortunately, most ads can’t be loaded asynchronously because they use document.write. (Doing document.write in an async script causes the entire page to be erased. We’ll see this in the examples below.) Some teams (GhostWriter, PageSpeed) have tried to solve the async document.write problem but it requires a lot of code and edge cases exist.
In my recent investigations into the performance of HTML Imports I discovered a way to make ads load asynchronously – even ads that use document.write. Let’s take a look at how HTML imports block, how to make HTML imports asynchronous, the dangers of doing this with document.write, and the workaround to make this all work.
HTML imports block rendering
HTML imports block rendering if used in the default way. This is unfortunate, especially given that this is a recent addition to HTML when the importance of not blocking rendering is well known. The HTML Imports spec is still a working draft, so it’s possible this could be switched so that they load asynchronously by default.
Nevertheless, HTML imports are typically created like this:
<link rel="import" href="import.php">
Content from the imported HTML document is inserted like this:
<div id=import-container></div>
<script>
var link = document.querySelector('link[rel=import]');
var content = link.import.querySelector('#imported-content');
document.getElementById('import-container').appendChild(content.cloneNode(true));
</script>
The LINK tag itself doesn’t block rendering – the browser knows the import can be downloaded asynchronously. But rendering is blocked when the browser encounters the first SCRIPT tag following the LINK. This behavior is demonstrated in the sync.php test page. To make the blocking observable, the import takes five seconds to download and then the pink “IMPORTED CONTENT” is displayed. The SCRIPT block is in the middle of the page so the first paragraph IS rendered, but the last paragraph IS NOT rendered until after five seconds. This demonstrates that HTML imports block rendering.
Running the examples: Currently HTML imports only work in Chrome Canary and you have to turn on the following flags in chrome://flags/: Experimental Web Platform features, Experimental JavaScript, and HTML Imports.
Making HTML imports async
It’s not too hard to make HTML imports asynchronous thus avoiding the default blocking behavior. Instead of using the LINK tag in markup, we create it using JavaScript:
var link = document.createElement('link');
link.rel = 'import';
link.onload = function() {
    var link = document.querySelector('link[rel=import]');
    var content = link.import.querySelector('#imported-content');
    document.getElementById('import-container').appendChild(content.cloneNode(true));
};
link.href = url;
document.getElementsByTagName('head')[0].appendChild(link);
The async.php test page shows how using this asynchronous pattern doesn’t block rendering – the last paragraph is rendered immediately, then after five seconds we see the pink “IMPORTED CONTENT” from the HTML import. This shows that HTML imports can be used without blocking the page from rendering.
HTML imports with document.write – watch out!
This is kind of weird and might be hard to grok: HTML imports have their own HTML document. BUT (here’s the complex part) any JavaScript within the HTML import is executed in the context of the main page. At least that’s the way it works now in Chrome. The spec doesn’t address this issue.
This is important because some 3rd party content (especially ads) use document.write. Some people might think that a document.write inside an HTML import would write to the HTML import’s document. But that’s not the case. Instead, document refers to the main page’s document. This can produce surprising (as in “bad”) results.
As shown in the sync docwrite.php and async docwrite.php test pages, when the HTML import contains a script that uses document.write it erases the content of the main page. If you’re uncertain whether the imported content uses document.write then it’s risky to use HTML imports. Or is it?
Safely using HTML imports with document.write
Since much 3rd party content (especially ads) use document.write, there’s a motivation to make them work with HTML imports. However, as shown by the previous examples, this can have disastrous results because when the HTML import does document.write it’s actually referencing the main page’s document and erases the main page.
There’s a simple “hack” to get around this. We can’t redefine document, but we CAN redefine document.write within the HTML import:
// inside the HTML import
document.write = function(msg) {
    document.currentScript.ownerDocument.write(msg);
};
With this change, all document.write output from scripts inside the HTML import goes to the HTML import’s document. This eliminates the problem of the HTML import clearing the main page. This fix is shown by the sync docwrite-override.php and async docwrite-override.php test pages.
Async (document.write) ads with HTML imports
Let’s see this technique in action. The async-ads.php test page includes Google’s show_ads.js to load real ads. The overridden version of document.write also echoes the output to the page so you can verify what’s happening. The document.write works and the ad is shown even though it’s loaded asynchronously.
This is a major accomplishment but there are some big caveats:
- Although we’ve overriddenÂ
document.write, there might be other JavaScript in the HTML import that assumes it’s running in the main page’s context (e.g.,location.href,document.title). - Some people believe it would be good to disable
document.write inside HTML imports, in which case ads wouldn’t work. - We need a fallback as support for HTML imports grows. This is possible by detecting support for HTML imports and reverting to the current (blocking) technique for ads.
Perhaps the biggest caveat is whether it’s realistic to expect website owners to do this. I don’t think a majority of websites would adopt this technique, but I like having an option to make ads async for websites that are willing to do the work. Right now, motivated website owners don’t have good alternatives for loading ads without blocking their own content on their page. I know some sites that have loaded ads at the bottom of the page in a hidden div and then clone them to the top when done, but this usually results in a drop in ad revenue because the ads load later. Using HTML imports allows the ad to be loaded at the top so we can have asynchronous behavior without a loss in ad revenue.
The goal of this post is to suggest that we find a way to solve one of today’s biggest obstacles to fast web pages: ads. The spec for HTML imports is a working draft and there’s only one implementation, so both are likely to change. My hope is we can make HTML imports asynchronous by default so they don’t block rendering, and use them as technique for achieving asynchronous ads.
Prebrowsing
 A favorite character from the MASH TV series is Corporal Walter Eugene O’Reilly, fondly referred to as “Radar” for his knack of anticipating events before they happen. Radar was a rare example of efficiency because he was able to carry out Lt. Col. Blake’s wishes before Blake had even issued the orders.
What if the browser could do the same thing? What if it anticipated the requests the user was going to need, and could complete those requests ahead of time? If this was possible, the performance impact would be significant. Even if just the few critical resources needed were already downloaded, pages would render much faster.
Browser cache isn’t enough
You might ask, “isn’t this what the cache is for?” Yes! In many cases when you visit a website the browser avoids making costly HTTP requests and just reads the necessary resources from disk cache. But there are many situations when the cache offers no help:
- first visit – The cache only comes into play on subsequent visits to a site. The first time you visit a site it hasn’t had time to cache any resources.
- cleared – The cache gets cleared more than you think. In addition to occasional clearing by the user, the cache can also be cleared by anti-virus software and browser bugs. (19% of Chrome users have their cache cleared at least once a week due to a bug.)
- purged – Since the cache is shared by every website the user visits, it’s possible for one website’s resources to get purged from the cache to make room for another’s.
- expired – 69% of resources don’t have any caching headers or are cacheable for less than one day. If the user revisits these pages and the browser determines the resource is expired, an HTTP request is needed to check for updates. Even if the response indicates the cached resource is still valid, these network delays still make pages load more slowly, especially on mobile.
- revved – Even if the website’s resources are in the cache from a previous visit, the website might have changed and uses different resources.
Something more is needed.
Prebrowsing techniques
In their quest to make websites faster, today’s browsers offer a number of features for doing work ahead of time. These “prebrowsing” (short for “predictive browsing” – a word I made up and a domain I own) techniques include:
<link rel="dns-prefetch" ...><link rel="prefetch" ...><link rel="prerender" ...>- DNS pre-resolution
- TCP pre-connect
- prefreshing
- the preloader
These features come into play at different times while navigating web pages. I break them into these three phases:
- previous page – If a web developer has high confidence about which page you’ll go to next, they can use LINK REL dns-prefetch, prefetch or prerender on the previous page to finish some work needed for the next page.
- transition – Once you navigate away from the previous page there’s a transition period after the previous page is unloaded but before the first byte of the next page arrives. During this time the web developer doesn’t have any control, but the browser can work in anticipation of the next page by doing DNS pre-resolution and TCP pre-connects, and perhaps even prefreshing resources.
- current page – As the current page is loading, browsers have a preloader that scans the HTML for downloads that can be started before they’re needed.
Let’s look at each of the prebrowsing techniques in the context of each phase.
Phase 1 – Previous page
As with any of this anticipatory work, there’s a risk that the prediction is wrong. If the anticipatory work is expensive (e.g., steals CPU from other processes, consumes battery, or wastes bandwidth) then caution is warranted. It would seem difficult to anticipate which page users will go to next, but high confidence scenarios do exist:
- If the user has done a search with an obvious result, that result page is likely to be loaded next.
- If the user navigated to a login page, the logged-in page is probably coming next.
- If the user is reading a multi-page article or paginated set of results, the page after the current page is likely to be next.
Let’s take the example of searching for Adventure Time to illustrate how different prebrowsing techniques can be used.
DNS-PREFETCH
If the user searched for Adventure Time then it’s likely the user will click on the result for Cartoon Network, in which case we can prefetch the DNS like this:
<link rel="dns-prefetch" href="//cartoonnetwork.com">
DNS lookups are very low cost – they only send a few hundred bytes over the network – so there’s not a lot of risk. But the upside can be significant. This study from 2008 showed a median DNS lookup time of ~87 ms and a 90th percentile of ~539 ms. DNS resolutions might be faster now. You can see your own DNS lookup times by going to chrome://histograms/DNS (in Chrome) and searching for the DNS.PrefetchResolution histogram. Across 1325 samples my median is 50 ms with an average of 236 ms – ouch!
In addition to resolving the DNS lookup, some browsers may go one step further and establish a TCP connection. In summary, using dns-prefetch can save a lot of time, especially for redirects and on mobile.
PREFETCH
If we’re more confident that the user will navigate to the Adventure Time page and we know some of its critical resources, we can download those resources early using prefetch:
<link rel="prefetch" href="http://cartoonnetwork.com/utils.js">
This is great, but the spec is vague, so it’s not surprising that browser implementations behave differently. For example,
- Firefox downloads just one prefetch item at a time, while Chrome prefetches up to ten resources in parallel.
- Android browser, Firefox, and Firefox mobile start prefetch requests after window.onload, but Chrome and Opera start them immediately possibly stealing TCP connections from more important resources needed for the current page.
- An unexpected behavior is that all the browsers that support prefetch cancel the request when the user transitions to the next page. This is strange because the purpose of prefetch is to get resources for the next page, but there might often not be enough time to download the entire response. Canceling the request means the browser has to start over when the user navigates to the expected page. A possible workaround is to add the “Accept-Ranges: bytes” header so that browsers can resume the request from where it left off.
It’s best to prefetch the most important resources in the page: scripts, stylesheets, and fonts. Only prefetch resources that are cacheable – which means that you probably should avoid prefetching HTML responses.
PRERENDER
If we’re really confident the user is going to the Adventure Time page next, we can prerender the page like this:
<link rel="prerender" href="http://cartoonnetwork.com/">
This is like opening the URL in a hidden tab – all the resources are downloaded, the DOM is created, the page is laid out, the CSS is applied, the JavaScript is executed, etc. If the user navigates to the specified href, then the hidden page is swapped into view making it appear to load instantly. Google Search has had this feature for years under the name Instant Pages. Microsoft recently announced they’re going to similarly use prerender in Bing on IE11.
Many pages use JavaScript for ads, analytics, and DHTML behavior (start a slideshow, play a video) that don’t make sense when the page is hidden. Website owners can workaround this issue by using the page visibility API to only execute that JavaScript once the page is visible.
Support for dns-prefetch, prefetch, and prerender is currently pretty spotty. The following table shows the results crowdsourced from my prebrowsing tests. You can see the full results here. Just as the IE team announced upcoming support for prerender, I hope other browsers will see the value of these features and add support as well.
| dns-prefetch | prefetch | prerender | |
|---|---|---|---|
| Android 4 | 4 | ||
| Chrome | 22+ | 31+1 | 22+ |
| Chrome Mobile | 29+ | ||
| Firefox | 22+2 | 23+2 | |
| Firefox Mobile | 24+ | 24+ | |
| IE | 113 | 113 | 113 |
| Opera | 15+ |
- 1 Need to use the
--prerender=enabledcommandline option. - 2 My friend at Mozilla said these features have been present since version 12.
- 3 This is based on a Bing blog post. It has not been tested.
Ilya Grigorik‘s High Performance Networking in Google Chrome is a fantastic source of information on these techniques, including many examples of how to see them in action in Chrome.
Phase 2 – Transition
When the user clicks a link the browser requests the next page’s HTML document. At this point the browser has to wait for the first byte to arrive before it can start processing the next page. The time-to-first-byte (TTFB) is fairly long – data from the HTTP Archive in BigQuery indicate a median TTFB of 561 ms and a 90th percentile of 1615 ms.
During this “transition” phase the browser is presumably idle – twiddling its thumbs waiting for the first byte of the next page. But that’s not so! Browser developers realized that this transition time is a HUGE window of opportunity for performance prebrowsing optimizations. Once the browser starts requesting a page, it doesn’t have to wait for that page to arrive to start working. Just like Radar, the browser can anticipate what will need to be done next and can start that work ahead of time.
DNS pre-resolution & TCP pre-connect
The browser doesn’t have a lot of context to go on – all it knows is the URL being requested, but that’s enough to do DNS pre-resolution and TCP pre-connect. Browsers can reference prior browsing history to find clues about the DNS and TCP work that’ll likely be needed. For example, suppose the user is navigating to http://cartoonnetwork.com/. From previous history the browser can remember what other domains were used by resources in that page. You can see this information in Chrome at chrome://dns. My history shows the following domains were seen previously:
- ads.cartoonnetwork.com
- gdyn.cartoonnetwork.com
- i.cdn.turner.com
During this transition (while it’s waiting for the first byte of Cartoon Network’s HTML document to arrive) the browser can resolve these DNS lookups. This is a low cost exercise that has significant payoffs as we saw in the earlier dns-prefetch discussion.
If the confidence is high enough, the browser can go a step further and establish a TCP connection (or two) for each domain. This will save time when the HTML document finally arrives and requires page resources. The Subresource PreConnects column in chrome://dns indicates when this occurs. For more information about dns-presolution and tcp-preconnect see DNS Prefetching.
Prefresh
Similar to the progression from LINK REL dns-prefetch to prefetch, the browser can progress from DNS lookups to actual fetching of resources that are likely to be needed by the page. The determination of which resources to fetch is based on prior browsing history, similar to what is done in DNS pre-resolution. This is implemented as an experimental feature in Chrome called “prefresh” that can be turned on using the --speculative-resource-prefetching="enabled" flag. You can see the resources that are predicted to be needed for a given URL by going to chrome://predictors and clicking on the Resource Prefetch Predictor tab.
The resource history records which resources were downloaded in previous visits to the same URL, how often the resource was hit as well as missed, and a score for the likelihood that the resource will be needed again. Based on these scores the browser can start downloading critical resources while it’s waiting for the first byte of the HTML document to arrive. Prefreshed resources are thus immediately available when the HTML needs them without the delays to fetch, read, and preprocess them. The implementation of prefresh is still evolving and being tested, but it holds potential to be another prebrowsing timesaver that can be utilized during the transition phase.
Phase 3 – Current Page
Once the current page starts loading there’s not much opportunity to do prebrowsing – the user has already arrived at their destination. However, given that the average page takes 6+ seconds to load, there is a benefit in finding all the necessary resources as early as possible and downloading them in a prioritized order. This is the role of the preloader.
Most of today’s browsers utilize a preloader – also called a lookahead parser or speculative parser. The preloader is, in my opinion, the most important browser performance optimization ever made. One study found that the preloader alone improved page load times by ~20%. The invention of preloaders was in response to the old browser behavior where scripts were downloaded one-at-a-time in daisy chain fashion.
Starting with IE 8, parsing the HTML document was modified such that it forked when an external SCRIPT SRC tag was hit: the main parser is blocked waiting for the script to download and execute, but the lookahead parser continues parsing the HTML only looking for tags that might generate HTTP requests (IMG, SCRIPT, LINK, IFRAME, etc.). The lookahead parser queues these requests resulting in a high degree of parallelized downloads. Given that the average web page today has 17 external scripts, you can imagine what page load times would be like if they were downloaded sequentially. Being able to download scripts and other requests in parallel results in much faster pages.
The preloader has changed the logic of how and when resources are requested. These changes can be summarized by the goal of loading critical resources (scripts and stylesheets) early while loading less critical resources (images) later. This simple goal can produce some surprising results that web developers should keep in mind. For example:
- JS responsive images get queued last – I’ve seen pages that had critical (bigger) images that were loaded using a JavaScript responsive images technique, while less critical (smaller) images were loaded using a normal IMG tag. Most of the time I see these images being downloaded from the same domain. The preloader looks ahead for IMG tags, sees all the less critical images, and adds those to the download queue for that domain. Later (after DOMContentLoaded) the JavaScript responsive images technique kicks in and adds the more critical images to the download queue – behind the less critical images! This is often not the expected nor desired behavior.
- scripts “at the bottom” get loaded “at the top” – A rule I promoted starting in 2007 is to move scripts to the bottom of the page. In the days before preloaders this would ensure that all the requests higher in the page, including images, got downloaded first – a good thing when the scripts weren’t needed to render the page. But most preloaders give scripts a higher priority than images. This can result in a script at the bottom stealing a TCP connection from an image higher in the page causing above-the-fold rendering to take longer.
When it comes to the preloader the bottomline is that the preloader is a fantastic performance optimization for browsers, but the logic is new and still evolving so web developers should be aware of how the preloader works and watch their pages for any unexpected download behavior.
As the low hanging fruit of web performance optimization is harvested, we have to look harder to find the next big wins. Prebrowsing is an area that holds a lot of potential to deliver pages instantly. Web developers and browser developers have the tools at their disposal and some are taking advantage of them to create these instant experiences. I hope we’ll see even wider browser support for these prebrowsing features, as well as wider adoption by web developers.
[Here are the slides and video of my Prebrowsing talk from Velocity New York 2013.]