Redirect caching deep dive
I was talking to a performance guru today who considers redirects one of the top two performance problems impacting web pages today. (The other was document.write.) I agree redirects are an issue, so much so that I wrote a chapter on avoiding redirects in High Performance Web Sites. What makes matters worse is that, even though redirects are cacheable, most browsers (even the new ones) don’t cache them.
Another performance guru, Eric Lawrence, sent me an email last week pointing out how cookies, status codes, and response headers affect redirect caching. Even though there are a few redirect tests in Browserscope, they don’t test all of these conditions. I wanted a more thorough picture of the state of redirect caching across browsers.
The Redirect Caching Tests page provides a test harness for exercising different redirect caching scenarios.
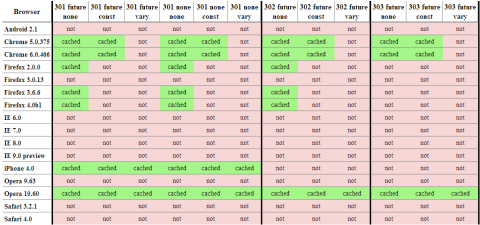
You can use the “Test Once” button to test a specific scenario, but if you choose “Test All” the harness runs through all the tests and offers to post the results (anonymously) to Browserscope. Here’s a snapshot of the results:
I realize you can’t read the results, but suffice it to say red is bad. If you click on the table you’ll go to the full results. They’re broken into two tables: redirects that should be cached, and redirects that should not be cached. For example, a 301 response with an expiration date in the future should be cached, but a 302 redirect with an expiration date in the past shouldn’t be cached. The official ruling can be found in RFC 2616. (Also, discussions Eric had with Mark Nottingham, chair of the Httpbis working group, indicate that 303 redirects with a future expiration date should be cached.)
Chrome, iPhone, and Opera 10.60 are doing the best job, but there’s still a lot of missed opportunities. IE 9 platform preview 3 still doesn’t cache any redirects, but Eric’s blog post, Caching Improvements in Internet Explorer 9, describes how that’ll be in the final version of IE9. If you use redirects that don’t change, make sure to use a 301 status code and set an expiration date in the future. That will ensure they’re cached in Chome, Firefox, iPhone, Opera, and IE9.
Please help out by running the test on your browser (especially mobile!) and contributing the results back to Browserscope so we can help browser vendors know what needs to be fixed.
Velocity: TCP and the Lower Bound of Web Performance
John Rauser (Amazon) was my favorite speaker at Velocity. His keynote on Creating Cultural Change was great. I recommend you watch the video.
John did another session that was longer and more technical entitled TCP and the Lower Bound of Web Performance. Unfortunately this wasn’t scheduled in the videotape room. But yesterday Mike Bailey contacted me saying he had recorded the talk with his Flip. With John’s approval, Mike has uploaded his video of John Rauser’s TCP talk from Velocity. This video runs out before the end of the talk, so make sure to follow along in the slides so you can walk through the conclusion yourself. [Update: Mike Bailey uploaded the last 7 minutes, so now you can hear the conclusion directly from John!]
John starts by taking a stab at what we should expect for coast-to-coast roundtrip latency:
- Roundtrip distance between the west coast and the east coast is 7400 km.
- The speed of light in a vacuum is 299,792.458 km/second.
- So the theoretical minimum for roundtrip latency is 25 ms.
- But light’s not traveling in a vacuum. It’s propagating in glass in fiber optic cables.
- The index of refraction of glass is 1.5, which means light travels at 66% of the speed in glass that it does in a vacuum.
- So a more realistic roundtrip latency is ~37 ms.
- Using a Linksys wireless router and a Comcast cable connection, John’s roundtrip latency is ~90ms. Which isn’t really that bad, given the other variables involved.
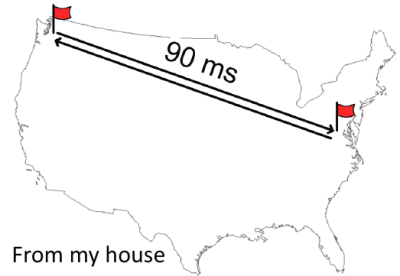
The problem is it’s been like this for well over a decade. This is about the same latency that Stuart Cheshire found in 1996. This is important because as developers we know that network latency matters when it comes to building a responsive web app.
With that backdrop, John launches into a history of TCP that leads us to the current state of network latency. The Internet was born in September of 1981 with RFC 793 documenting the Transmission Control Protocol, better known as TCP.
Given the size of the TCP window (64 kB) there was a chance for congestion, as noted in Congestion Control in IP/TCP Internetworks (RFC 896):
Should the round-trip time exceed the maximum retransmission interval for any host, that host will begin to introduce more and more copies of the same datagrams into the net. The network is now in serious trouble. Eventually all available buffers in the switching nodes will be full and packets must be dropped. Hosts are sending each packet several times, and eventually some copy of each packet arrives at its destination. This is congestion collapse.
This condition is stable. Once the saturation point has been reached, if the algorithm for selecting packets to be dropped is fair, the network will continue to operate in a degraded condition. Congestion collapse and pathological congestion are not normally seen in the ARPANET / MILNET system because these networks have substantial excess capacity.
Although it’s true that in 1984, when RFC 896 was written, the Internet had “substantial excess capacity”, that quickly changed. In 1981 there were 213 hosts on the Internet. But the number of hosts started growing rapidly. In October of 1986, with over 5000 hosts on the Internet, there occurred the first in a series of congestion collapse events.

This led to the development of the TCP slow start algorithm, as described in RFCs 2581, 3390, and 1122. The key to this algorithm is the introduction of a new concept called the congestion window (cwnd) which is maintained by the server. The basic algorithm is:
- initalize cwnd to 3 full segments
- increment cwnd by one full segment for each ACK
TCP slow start was widely adopted. As seen in the following packet flow diagram, the number of packets starts small and doubles, thus avoiding the congestion collision experienced previously.
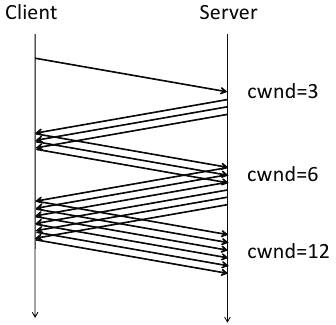
There were still inefficiencies, however. In some situations, too many ACKs would be sent. Thus we now have the delayed ACK algorithm from RFC 813. So the nice packet growth seen above now looks like this:
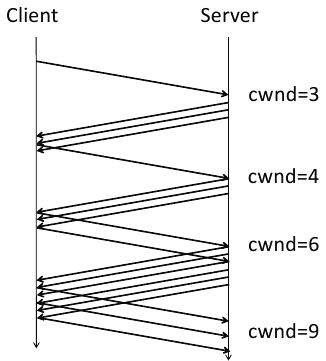
At this point, after referencing so many RFCs and showing numerous ACK diagrams, John aptly asks, “Why should we care?” Sadly, the video stops at this point around slide 160. But if we continue through the slides we see how John brings us back to what web developers deal with on a daily basis.
Keeping in mind that the size of a segment is 1460 bytes (“1500 octets” as specified in RFC 894 minus 40 bytes for TCP and IP headers), we see how many roundtrips are required to deliver various payload sizes. (I overlaid a kB conversion in red.)
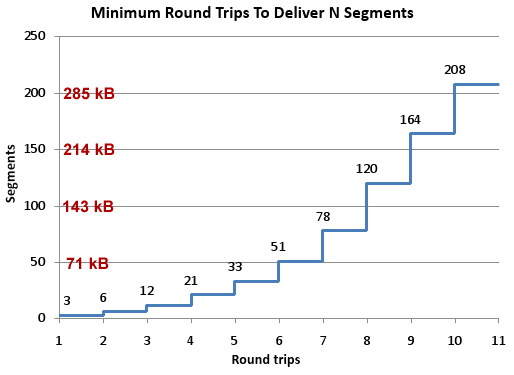
John’s conclusion is that “TCP slow start means that network latency strictly limits the throughput of fresh connections.” He gives these recommendations for what can be done about the situation:
- Carefully consider every byte of content
- Think about what goes into those first few packets
- 2.1 Keep your cookies small
- 2.2 Open connections for assets in the first three packets
- 2.3 Download small assets first
- Accept the speed of light (move content closer to users)
All web developers need at least a basic understanding of the protocol used by their apps. John delivers a great presentation that is informative and engaging, with real takeaways. Enjoy!
Velocity: Forcing Gzip Compression
Tony Gentilcore was my officemate when I first started at Google. I was proud of my heritage as “the YSlow guy”. After all, YSlow was well over 1M downloads. After a few days I found out that Tony was the creator of Fasterfox – topping 11M downloads. Needless to say, we hit it off and had a great year brainstorming techniques for optimizing web performance.
During that time, Tony was working with the Google Search team and discovered something interesting: ~15% of users with gzip-capable browsers were not sending an appropriate Accept-Encoding request header. As a result, they were sent uncompressed responses that were 3x bigger resulting in slower page load times. After some investigation, Tony discovered that intermediaries (proxies and anti-virus software) were stripping or munging the Accept-Encoding header. My blog post Who’s not getting gzip? summarizes the work with links to more information. Read Tony’s chapter in Even Faster Web Sites for all the details.
Tony is now working on Chrome, but the discovery he made has fueled the work of Andy Martone and others on the Google Search team to see if they could improve page load times for users who weren’t getting compressed responses. They had an idea:
For requests with missing or mangled Accept-Encoding headers, inspect the User-Agent to identify browsers that should understand gzip.
Test their ability to decompress gzip.
If successful, send them gzipped content!
This is a valid strategy given that the HTTP spec says that, in the absence of an Accept-Encoding header, the server may send a different content encoding based on additional information (such as the encodings known to be supported by the particular client).
During his presentation at Velocity, Forcing Gzip Compression, Andy describes how Google Search implemented this technique:
- At the bottom of a page, inject JavaScript to:
- Check for a cookie.
- If absent, set a session cookie saying “compression NOT ok”.
- Write out an iframe element to the page.
- The browser then makes a request for the iframe contents.
- The server responds with an HTML document that is always compressed.
- If the browser understands the compressed response, it executes the inlined JavaScript and sets the session cookie to “compression ok”.
- On subsequent requests, if the server sees the “compression ok” cookie it can send compressed responses.
The savings are significant. An average Google Search results page is 34 kB, which compresses down to 10 kB. The ability to send a compressed response cuts page load times by ~15% for these affected users.
Andy’s slides contain more details about how to only run the test once, recommended cookie lifetimes, and details on serving the iframe. Since this discovery I’ve talked to folks at other web sites that confirm these mysterious requests that are missing an Accept-Encoding header. Check it out on your web site – 15% is a significant slice of users! If you’d like to improve their page load times, take Andy’s advice and send them a compressed response that is smaller and faster.
Mobile cache file sizes
Mobile is big, but knowledge about how to make a mobile web site fast is lacking. The state of mobile web performance is in a similar place as desktop was six years ago when I started my performance deep dive. How many of us are happy with the speed of web pages on mobile? (I’m not.) How many of us know the top 10 best practices for building high performance mobile web sites? (I don’t.)
I’ve been focusing more on mobile in order to help build this set of best practices. Browserscope is a valuable resource since it measures all browsers, both mobile and desktop. The Network category for popular mobile browsers shows information about max connections per hostname, parallel script loading, redirect caching, and more. Since Browserscope’s data is crowdsourced it’s easy to get coverage on a wide variety of mobile devices. The table below shows the results from Browserscope for some popular mobile devices.
One thing I’ve wanted to measure on mobile is the browser’s cache. Caching on mobile devices is a cause for concern. In my experience a page I visited just a few minutes ago doesn’t seem to be cached when I visit it again. A few months ago I started creating tests for measuring the browser’s cache.
That’s why I was especially excited to see Ryan Grove’s post on Mobile Browser Cache Limits. I noticed his results were quite different from mine, so I commented on his blog post and invited him to contact me. Which he did! It’s great to find someone to collaborate with, especially when designing tests like this where another pair of eyes is a big help.
Ryan and I created a new test design. He’s deployed his under the name cachetest on GitHub. My implementation is called Max Cache File Size. I’m hosting it so you can run it immediately. I’ve integrated it with Browserscope as a User Test. Anyone who runs my hosted version has the option to post their results (anonymously) to Browserscope and contribute to building a repository for script cache sizes for all browsers.
Here’s a link to the Max Cache File Size results on Browserscope. A summary of the results with some other findings follows:
| Browser | Max Cached Script Size Same Session |
Cache Cross Lock/Unlock |
Cache Cross Power Cycle |
|---|---|---|---|
| Android 2.1 | 4 MB | yes | yes |
| Android 2.2 | 2 MB | yes | yes |
| iPad | 4 MB | yes | no |
| iPhone 3 | 4 MB | yes | no |
| iPhone 4 | 4 MB | yes | no |
| Palm Pre | 1 MB | yes | yes |
My Max Cache File Size test measures the largest script that’s cached in the same session (going from one page to another page). Many mobile devices reach the maximum size tested – 4MB. It’s interesting to see that in the recent upgrade from Android 2.1 to 2.2, the maximum cached script size drops from 4MB to 2MB. The Palm Pre registers at 320kB – much smaller than the others but large enough to handle many real world situations. Note that these sizes are the script’s uncompressed size.
Knowing the cache size that applies during a single session is valuable, but users often revisit pages after locking and unlocking their device, and some users might even power cycle their device between visits. Ryan and I manually tested a few devices under these scenarios – the results are shown in the previous table. Although results are mixed for the power cycling case, the cached items persist across lock/unlock. For me personally, this is the more typical case. (I only power cycle when I’m on the plane or need to reset the device.)
These results show that the 15 kB and 25 kB size limit warnings for a single resource are no longer a concern for mobile devices. However, even though the test went as high as 4 MB (uncompressed), I dearly hope you’re not even close to that size. (I saw similar results for stylesheets, but removed them from the automated test because stylesheets over ~1 MB cause problems on the iPhone.)
It’s great to have this data, and have it verified by different sources. But this is only testing the maximum size of a single script and stylesheet that can be cached. I believe the bigger issue for mobile is the maximum cache size. A few months ago I wrote a Call to improve browser caching. I wrote that in the context of desktop browsers, where I have visibility into the browser’s cache and available disk space. I think the size of mobile caches is even smaller. If you have information about the size of the browser cache on mobile devices, or tests to determine that, please share them in the comments below.
Finally, please run the Max Cache File Size test and add more data to the results.
Many thanks to Ryan Grove for working on this caching test – check out his updated post: Mobile Browser Cache Limits, Revisited. And thanks to Lindsey Simon for making Browserscope such a great framework for crowdsourcing browser performance data.
Diffable: only download the deltas
There were many new products and projects announced at Velocity, but one that I just found out about is Diffable. It’s ironic that I missed this one given that it happened at Velocity and is from Google. The announcement was made during a whiteboard talk, so it didn’t get much attention. If your web site has large JavaScript downloads you’ll want to learn more about this performance optimization technique.
The Diffable open source project has plenty of information, including the Diffable slides used by Josh Harrison and James deBoer at Velocity. As explained in the slides, Diffable uses differential compression to reduce the size of JavaScript downloads. It makes a lot of sense. Suppose your web site has a large external script. When a new release comes out, it’s often the case that a bulk of that large script is unchanged. And yet, users have to download the entire new script even if the old script is still cached.
Josh and James work on Google Maps which has a main script that is ~300K. A typical revision for this 300K script produces patches that are less than 20K. It’s wasteful to download that other 280K if the user has the old revision in their cache. That’s the inspiration for Diffable.
Diffable is implemented on the server and the client. The server component records revision deltas so it can return a patch to bring older versions up to date. The client component (written in JavaScript) detects if an older version is cached and if necessary requests the patch to the current version. The client component knows how to merge the patch with the cached version and evals the result.
The savings are significant. Using Diffable has reduced page load times in Google Maps by more than 1200 milliseconds (~25%). Note that this benefit only affects users that have an older version of the script in cache. For Google Maps that’s 20-25% of users.
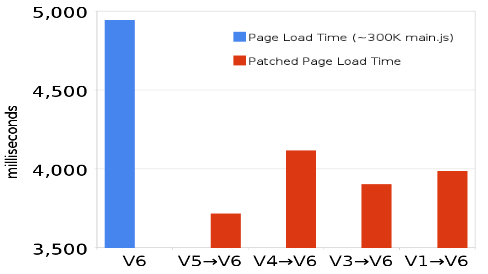
In this post I’ve used scripts as the example, but Diffable works with other resources including stylesheets and HTML. The biggest benefit is with scripts because of their notorious blocking behavior. The Diffable slides contain more information including how JSON is used as the delta format, stats that show there’s no performance hit for using eval, and how Diffable also causes the page to be enabled sooner due to faster JavaScript execution. Give it a look.
Velocity: Google Maps API performance
Several months ago I saw Susannah Raub do an internal tech talk on the performance improvements behind Google Maps API v3. She kindly agreed to reprise the talk at Velocity. Luckily it was videotaped, and the slides (ODP) are available, too. It’s a strong case study on improving performance, is valuable for developers working with the Google Maps API, and has a few takeaways that I’ll blog about more soon.
Susannah starts off bravely by showing how Google Maps API v2 takes 17 seconds to load on an iPhone. This was the motivation for the work on v3 – to improve performance. In order to improve performance you have to start by measuring it. The Google Maps team broke down “performance” into three categories:
- user perceived latency – how long it takes for the page to appear usable, in this case for the map to be rendered
- page ready time – how long it takes for the page to become usable, e.g. for the map to be draggable
- page load time – how long it takes for all the elements to be present, in the case of maps this includes all of the map controls to be loaded and working
The team wanted to measure all of these areas. It’s fairly easy to find tools to measure performance on the desktop – the Google Maps teamed used HttpWatch. Performance tools, or any development tools for that matter, are harder to come by in the mobile space. But the team especially wanted to focus on creating a fast experience on mobile devices. They ended up using Fiddler as a proxy to gain visibility into the page’s performance profile.
future blog post #1: Coincidentally, today I saw a tweet about Craig Dunn’s instructions for Monitoring iPhone web traffic (with Fiddler). This is a huge takeaway for anyone doing web development for mobile. At Velocity, Eric Lawrence (creator of Fiddler) announced Fiddler support for the HTTP Archive Specification. The HTTP Archive (HAR) format is a specification I initiated over a year ago with folks from HttpWatch and Firebug. HAR is becoming the industry standard just as I had hoped and is now supported in numerous developer tools. I wrote one such tool, called HAR to Page Speed, that takes a HAR file and displays a Page Speed performance analysis as well as an HTTP waterfall chart. Putting all these pieces together, you can now load a web site on your iPhone, monitor it with Fiddler, export it to a HAR file, and upload it to HAR to Page Speed to find out how it performs. Given Fiddler’s extensive capabilities for creating addons, I expect it won’t be long before all of this is built into Fiddler itself.
In the case of Google Maps API, the long pole in the tent was main.js. They have a small (15K) bootstrap script that loads main.js (180K). (All of the script sizes in this blog post are UNcompressed sizes.) The performance impact of main.js was especially bad on mobile devices because of less caching. They compiled their JavaScript (using Closure) and combined three HTTP requests into one.
future blog post #2: The team also realized that although their JavaScript download was large, the revisions between releases was small. They created a framework for only downloading deltas when possible that cut seconds off their download times. More on this tomorrow.
These performance improvements helped, but they wanted to go further. They redesigned their code using an MVC architecture. As a result, the initial download only needs to include the models, which are small. The larger views and controllers that do all the heavy lifting are loaded asynchronously. This reduced the initial bootstrap script from 15K to 4K, and the main.js from 180K to 33K.
The results speak for themselves. Susannah concludes by showing how v3 of Google Maps API takes only 5 seconds to load on the iPhone, compared to v2’s 17 seconds. The best practices the team employed for making Google Maps faster are valuable for anyone working on JavaScript-heavy web sites. Take a look at the video and slides, and watch here for a follow-up on Fiddler for iPhone and loading JavaScript deltas.
Velocity: Top 5 Mistakes of Massive CSS
Nicole Sullivan and Stoyan Stefanov had the #3 highest rated session at Velocity – The Top 5 Mistakes of Massive CSS. Nicole (aka, “stubbornella”) wrote a blog post summarizing their work. The motivator for paying attention to CSS are these stats that show how bad things are across the Alexa Top 1000:
- 42% don’t GZIP CSS
- 44% have more than 2 CSS external files
- 56% serve CSS with cookies
- 62% don’t minify
- 21% have greater than 100K of CSS
Many of these problems are measured by YSlow and Page Speed, but the solutions still aren’t widely adopted. Nicole goes on to highlight more best practices for reducing the impact of CSS including minimizing float and using a reset stylesheet.
Checkout the slides and video of Nicole and Stoyan’s talk to learn how to avoid having CSS block your page from rendering.
| Choose Your Own Adventure | Adam Jacob | Opscode |
| TCP and the Lower Bound of Web Performance | John Rauser | Amazon |
| The Top 5 Mistakes of Massive CSS | Nicole Sullivan | Consultant |
| Building Performance Into the New Yahoo! Homepage | Nicholas Zakas | Yahoo! |
| Hidden Scalability Gotchas in Memcached and Friends | Neil Gunther | Performance Dynamics Company |
| Internet Explorer 9 | Jason Weber | Microsoft |
| Creating Cultural Change | John Rauser | Amazon |
| Scalable Internet Architectures | Theo Schlossnagle | OmniTI |
| Ignite Velocity | Andrew Shafer | Cloudscaling |
| The Upside of Downtime: How to Turn a Disaster Into an Opportunity | Lenny Rachitsky | Webmetrics/Neustar |
| Metrics 101: What to Measure on Your Website | Sean Power | Watching Websites |
| The 90-Minute Optimization Life Cycle: Fast by Default Before Our Eyes? | Joshua Bixby | Strangeloop Networks |
| Progressive Enhancement: Tools and Techniques | Anne Sullivan | |
| Chrome Fast. | Mike Belshe |
Back to blogging after Velocity
The last few weeks have been hectic. I was in London and Paris for 10 days. I returned a day before Velocity started. Most of you experienced or have heard about the awesomeness that was Velocity – great speakers, sponsors, and attendees. Right after Velocity I headed up to Foo Camp at O’Reilly HQ. This week I’ve been catching up on all the email that accumulated over three weeks.
During this time blogging has taken a backseat. But now that my head is above water I want to start relaying some of the key takeaways from Velocity. I wrote my Velocity wrap-up and mentioned my favorite sessions. But here are the top 10 sessions based on the attendee ratings:
- Choose Your Own Adventure by Adam Jacob, Opscode (unofficial video snippets)
- TCP and the Lower Bound of Web Performance by John Rauser, Amazon (slides)
- The Top 5 Mistakes of Massive CSS by Nicole Sullivan, consultant and Stoyan Stefanov, Yahoo! (video)
- Building Performance Into the New Yahoo! Homepage by Nicholas Zakas, Yahoo! (slides)
- Hidden Scalability Gotchas in Memcached and Friends by Neil Gunther Performance Dynamics and Shanti Subramanyam and Stefan Parvu, Oracle (video)
- Internet Explorer 9 by Jason Weber, Microsoft (slides)
- Creating Cultural Change by John Rauser, Amazon (video)
- Scalable Internet Architectures by Theo Schlossnagle, OmniTI (slides)
- The Upside of Downtime: How to Turn a Disaster Into an Opportunity by Lenny Rachitsky, Webmetrics/Neustar (video, slides)
- Tied for #10:
- Metrics 101: What to Measure on Your Website by Sean Power, Watching Websites (slides)
- The 90-Minute Optimization Life Cycle: Fast by Default Before Our Eyes? by Joshua Bixby and Hooman Beheshti, Strangeloop Networks
- Progressive Enhancement: Tools and Techniques by Anne Sullivan, Google (slides)
- Chrome Fast. by Mike Belshe, Google (slides)
Some things to highlight: Adam Jacob is an incredible speaker – insightful and funny. John Rauser is the speaker I enjoyed the most – he shows up twice at #2 and #7. Two of the browser presentations registered. The workshops this year were incredible and very well attended – four of them registered in the top 10 (#8, #10a, #10b, and #10c). Annie Sullivan rated high and it was her first time speaking at a conference.
The last two years at Velocity we’ve only been able to videotape the talks in one room, so this year that means about a third of the talks were videotaped. Four of these top rated sessions were taped. Next year I’ll try to get more of the top speakers in the video room. I’ve asked the five speakers without slides to upload them to the Velocity web site. Check back next week if you want those.
I actually feel electricity running up and down my spine looking over these talks. To think I had something to do with pulling these gurus together and offering a place for them to share what they know – it’s humbling and exhilarating at the same time. I’ll be doing some more Velocity-related posts on specific sessions next week, so stay tuned.
| Choose Your Own Adventure | Adam Jacob | Opscode |
| TCP and the Lower Bound of Web Performance | John Rauser | Amazon |
| The Top 5 Mistakes of Massive CSS | Nicole Sullivan | Consultant |
| Building Performance Into the New Yahoo! Homepage | Nicholas Zakas | Yahoo! |
| Hidden Scalability Gotchas in Memcached and Friends | Neil Gunther | Performance Dynamics Company |
| Internet Explorer 9 | Jason Weber | Microsoft |
| Creating Cultural Change | John Rauser | Amazon |
| Scalable Internet Architectures | Theo Schlossnagle | OmniTI |
| Ignite Velocity | Andrew Shafer | Cloudscaling |
| The Upside of Downtime: How to Turn a Disaster Into an Opportunity | Lenny Rachitsky | Webmetrics/Neustar |
| Metrics 101: What to Measure on Your Website | Sean Power | Watching Websites |
| The 90-Minute Optimization Life Cycle: Fast by Default Before Our Eyes? | Joshua Bixby | Strangeloop Networks |
| Progressive Enhancement: Tools and Techniques | Anne Sullivan | |
| Chrome Fast. | Mike Belshe |
Velocity wrap-up
Velocity ended yesterday at 6pm – and the final presentations from 5:20-6:00 were still packed! It was a great conference. I’m wiped out from talking web performance from 8am to 10pm the last three days.
The highlight of the conference was the conference itself:
- 1200 attendees
- 89 speakers
- 28 sponsors
- 26 exhibitors
Compare that to the numbers for Velocity 2008: 600 attendees, 65 speakers, 9 sponsors, 17 exhibitors. The growth is a testimonial for how the focus on web performance and operations has increased in just 2 years. Companies know their web sites have to be fast, available, and scalable. That’s why they come to Velocity.
We added a third track this year on Culture which meant I wasn’t able to attend every performance talk. But here are the talks I saw that really stood out:
- Creating Cultural Change (video) and TCP and the Lower Bound of Web Performance (slides) – John Rauser (Amazon) was the breakthrough speaker of the conference. Both talks not only had great content, they were also funny and delivered with style.
- Datacenter Infrastructure Innovation (video) – James Hamilton (Amazon) presents surprising stats about the true costs of infrastructure services.
- Speed Matters (video) РUrs H̦lzle (Google) evangelizes creating a faster web via a long list of performance initiatives. Make sure to check out the links at the end to SSL and congestion window improvements.
- The O’Reilly Radar (video, slides) – Tim O’Reilly leads the rally cry for the critical role of performance and operations to the future of the Web.
- Don’t Let Third Parties Slow You Down (video, slides) – Michael Kleber (Google) presents some great stats on the impact of 3rd party content, and at the end slips in some performance improvements he’s working on for Google AdSense.
- JSMeter: Characterizing Real-World Behavior of JavaScript Programs (slides) – Ben Zorn (Microsoft Research) reveals how unrepresentative today’s benchmarks are compared to real web sites. I really recommend you check out his charts.
- Building Performance Into the New Yahoo! Homepage (slides) – Nicholas Zakas (Yahoo!) provided a case study of adding advanced performance techniques including progressive enhancement.
There were other great talks such as The Top 5 Mistakes of Massive CSS and Google Maps API v3 – Built First for Mobile for which we’re still waiting for slides and possibly video. I encourage you to check out all the slides and videos – remember, I was only able to sit in on one of three tracks. There’s a lot more to see.
Thanks for making Velocity 2010 so amazing. I’ll see you at Velocity 2011! (Remember to register early!)
Velocity is coming fast June 22-24
Jesse Robbins and I co-chair Velocity – the web performance and operations conference run by O’Reilly. This year’s Velocity is coming fast (get it?) – June 22-24 at the Santa Clara Convention Center. This is the third year for Velocity. The first two years sold out, and this year is looking even stronger. We’ve added a third track so that’s 50% more workshops and sessions. That means more gurus to talk to and more topics to choose from.
Jesse did a post today about the ops side of the conference. Here are some of my favorites from the web performance track:
- Mobile Web High Performance – This workshop (workshops are on Tues June 22) is by O’Reilly author Maximiliano Firtman. Mobile is big and only a few people (including Maximiliano) know the performance side of mobile. His book? Programming the Mobile Web
- Progressive Enhancement: Tools and Techniques – The most important pattern I recommend for today’s web sites is to render the page quickly and adorn later with JavaScript. Some of the more advanced web apps are doing this, but otherwise it’s not a well known pattern. Annie is one of my favorite performance developers at Google. She has built sites that do progressive enhancement, so I’m super psyched that she agreed to give this workshop. Very important for anyone with a bunch of JavaScript in their site.
- Building Performance Into the New Yahoo! Homepage – Nicholas Zakas, JavaScript performance guru, talks about the real world story of making Yahoo! front page twice as fast.
- The Top 5 Mistakes of Massive CSS – Nicole Sullivan (consultant) and Stoyan Stefanov (Yahoo!) share their lessons learned optimizing the CSS for Facebook and Yahoo! Search.
- The Firefox, Chrome, and Internet Explorer teams will be there to talk about the latest performance improvements to their browsers. That’s followed by the Browser Panel where you get to ask more questions.
- Lightning Demos on Wed and Thurs will give everyone a chance to see dynaTrace, Firebug, YSlow, Page Speed, HttpWatch, AOL (Web)Pagetest, Speed Tracer, and Fiddler.
- We have an amazing line-up of keynoters: Wednesday morning features James Hamilton (Amazon), Urs Hölzle (Google), and Tim O’Reilly (O’Reilly Media). All in one morning! Thursday brings back John Adams (Twitter) and Bobby Johnson (Facebook). Their Velocity 2009 talks were standing room only.
I’m looking forward to all the talks and catching up with the speakers. I’m most excited about the hallway conversations. It’s great hearing about what other developers have discovered during their own performance optimization projects. I especially enjoy how accessible the speakers are. It’s amazing how willing everyone is to share what they’ve learned and to work together to advance the state of web performance and operations. After all, that’s what Velocity is all about.

