Making the HTTP Archive faster
This week I finally got time to do some coding on the HTTP Archive. Coincidentally (ironically?) I needed to focus on performance. Hah! This turned out to be a good story with a few takeaways – info about the HTTP Archive, some MySQL optimizations, and a lesson learned about dynamic script loaders.
Setting the stage
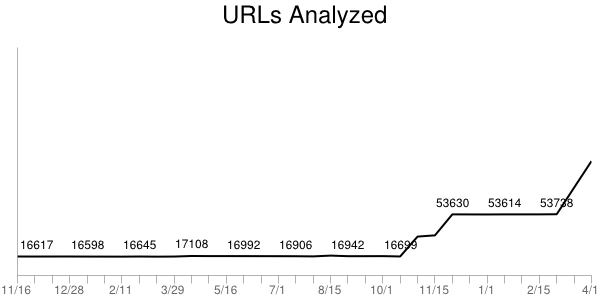
The HTTP Archive started in November 2010 by analyzing 10K URLs and storing their information (subresource URLs, HTTP headers, sizes, etc.) in a MySQL database. We do these runs twice each month. In November 2011 we began increasing the number of URLs to 25K, 50K, 75K, and finally hit 100K this month. Our goal is to hit 1M URLs by the end of 2012.
The MySQL schema in use today is by-and-large the same one I wrote in a few hours back in November 2010. I didn’t spend much time on it – I’ve created numerous databases like this and was able to quickly get something that got the job done and was fast. I knew it wouldn’t scale as the size of the archive and number of URLs grew, but I left that for another day.
That day had arrived.
DB schema
The website was feeling slow. I figured I had reached that curve in the hockey stick where my year-old schema that worked on two orders of magnitude less data was showing its warts. I saw plenty of slow queries in the log. I occasionally did some profiling and was easily able to identify queries that took 500 ms or more; some even took 10+ seconds. I’ve built big databases before and had some tricks up my sleeve so I sat down today to pinpoint the long poles in the tent and cut them down.
The first was pretty simple. The urls table has over 1M URLs. The only index was based on the URL string – a blob. It took 500-1000 ms to do a lookup. The main place this happens is looking up the URL’s rank, for example, in the last crawl Whole Foods was ranked 5,872 (according to Alexa). This is a fairly non-critical piece of information, so slowing down the page 500-1000 ms wasn’t acceptable. Plus this seems like a simple lookup ripe for optimizing.
When I described this problem to my Velocity co-chair, John Allspaw, he suggested creating a hash for the URL that would be faster to index. I understood the concept but had never done this before. I didn’t find any obvious pointers out there on “the Web” so I rolled my own. I started with md5(), but that produced a fairly long string that was alphanumeric (hex):
select md5("http://www.wholefoodsmarket.com/");
=> 0a0936fe5c690a3b468a6895efaaff83
I didn’t think it would be that much faster to index off the md5() hex string (although I didn’t test this). Assuming that md5() strings are evenly distributed, I settled on taking a substring:
select substring(md5("http://www.wholefoodsmarket.com/"), 1, 4);
=> 0a09
This was still hex and I thought an int would be a faster index (but again, I didn’t test this). So I added a call to conv() to convert the hex to an int:
select conv(substring(md5("http://www.wholefoodsmarket.com/"), 1, 4), 16, 10);
=> 2569
I was pretty happy. This maps URLs across 64K hashes. I’m assuming they’re evenly distributed. This conversion is only done a few times per page so the overhead is low. If you have a better solution please comment below, but overall I thought this would work – and it did! Those 500+ ms queries went down to < 1 ms. Yay!
But the page was still slow. Darn!
Duh – it’s the frontend
This and a few other MySQL changes shaved a good 2-3 seconds of the page load time but the page still felt slow. The biggest problem was rendering – I could tell the page arrived quickly but something was blocking the rendering. This is more familiar performance territory for me so I gleefully rolled up my sleeves and pulled out my WPO toolbox.
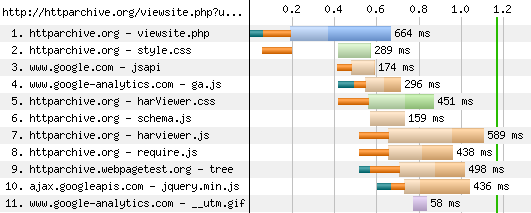
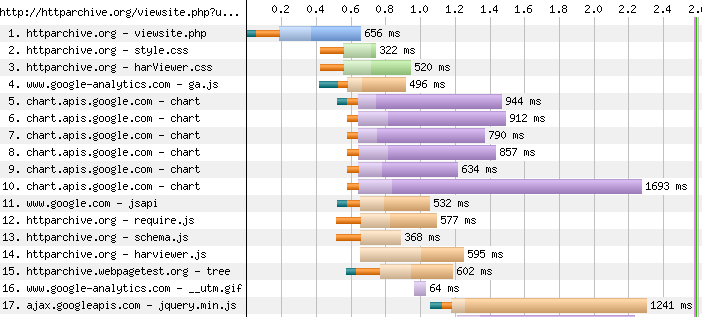
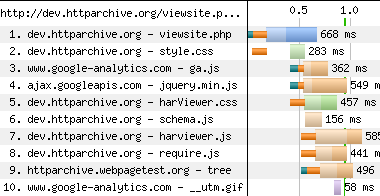
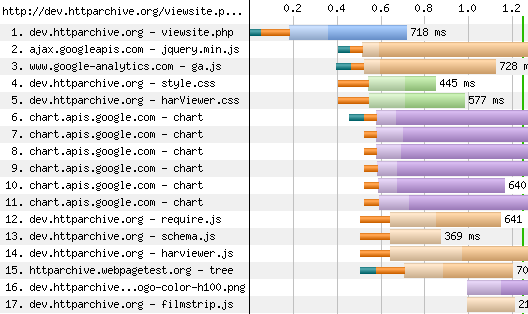
The page being optimized is viewsite.php. I used WebPagetest to capture a waterfall chart and screenshots for Chrome 18, Firefox 11, IE 8, and IE 9. The blocking behavior and rendering times were not what I consider high performance. (Click on the waterfall chart to go to the detailed WebPagetest results.)
These waterfall charts looked really wrong to me. The start render times (green vertical line) were all too high: Chrome 1.2 seconds, Firefox 2.6 seconds, IE8 1.6 seconds, and IE9 2.4 seconds. Also, too many resources were downloading and potentially blocking start render. This page has a lot of content, but most of the scripts are loaded asynchronously and so shouldn’t block rendering. Something was defeating that optimization.
Docwrite blocks
I immediately honed in on jquery.min.js because it was often in the critical path or appeared to push out the start render time. I saw in the code that it was being loaded using Google Libraries API. Here’s the code that was being used to load jquery.min.js:
<script src="http://www.google.com/jsapi"></script>
<script>
google.load("jquery", "1.5.1");
</script>
I’ve looked at (and built) numerous async script loaders and know there are a lot of details to get right, so I dug into the jsapi script to see what was happening. I saw the typical createElement-insertBefore pattern popularized by the Google Analytics async snippet. But upon walking through the code I discovered that jquery.min.js was being loaded by this line:
m.write('<script src="'+b+'" type="text/javascript"><\/script>'):
The jsapi script was using document.write to load jquery.min.js. While it’s true that document.write has some asynchronous benefits, it’s more limited than the createElement-insertBefore pattern. Serendipitously, I was just talking with someone a few weeks ago about deprecating the jsapi script because it introduces an extra HTTP request, and instead recommend that people just load the script directly. So that’s what I did.
We don’t need no stinkin’ script loader
In my case I knew that jquery.min.js could be loaded async, so I replaced the google.load code with this:
var sNew = document.createElement("script");
sNew.async = true;
sNew.src = "http://ajax.googleapis.com/ajax/libs/jquery/1.5.1/jquery.min.js";
var s0 = document.getElementsByTagName('script')[0];
s0.parentNode.insertBefore(sNew, s0);
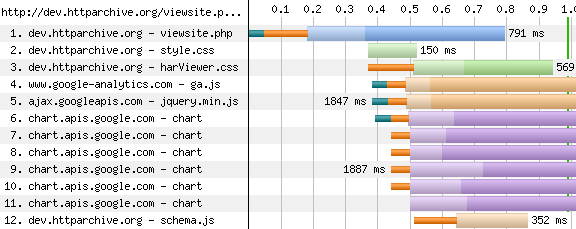
This made the start render times and waterfall charts look much better:
Chrome 18:
Firefox 11:
Internet Explorer 8:
Internet Explorer 9:
There was better parallelization of downloads and the start render times improved. Chrome went from 1.2 to 0.9 seconds. Firefox went from 2.6 to 1.3 seconds. IE8 went from 1.6 to 1.1 seconds. IE9 went from 2.4 to 1.0 seconds.
This was a fun day spent making the HTTP Archive faster. Even though I consider myself a seasoned veteran when it comes to web performance, I still found a handful of takeaways including some oldies that still ring true:
- Even for web pages that have significant backend delays, don’t forget to focus on the frontend. After all, that is the Performance Golden Rule.
- Be careful using script loaders. They have to handle diverse script loading scenarios across a large number of browsers. If you know what you want it might be better to just do it yourself.
- Be careful using JavaScript libraries. In this case
jquery.min.jsis only being used for the drop down About menu. That’s 84K (~30K compressed) of JavaScript for a fairly simple behavior.
If you’re curious about why document.write results in worse performance for dynamic script loading, I’ll dig into that in tomorrow’s blog post. Hasta mañana.
Radio link and Nav Timing
In Making a mobile connection I describe how after just a few seconds of inactivity your mobile phone demotes the radio link to your carrier network. It typically takes 1-2 seconds to re-establish the radio link to full bandwidth capacity. This is a huge delay!
A few days ago I was discussing desktop vs. mobile page load times with some web performance wonks. These times were gathered from real users via the W3C Nav Timing API. We started chatting about why the mobile times were worse – slower connection speeds, less cache space, etc. – and it hit me that taking 2 seconds to re-establish the radio link might account for much of what makes mobile sites slower, especially in RUM (Real User Monitoring) vs. synthetic testing. And I wondered:
After some initial testing it looks like the answers are:
I started by creating a Nav Timing test page that shows the values from Nav Timing. If you load the page you’ll see something like this. (Please look at page source to see how I calculate these conceptual time values.)
total time = 239 ms
dns = 119 ms
connect = 16 ms
ttfb = 61 ms
HTML = 0 ms
frontend = 42 ms
NOTE: Nav timing is available in Android 4. I’m not aware of any other mobile platform that has it, so you’ll need an Android 4 device to run these tests. You should close all/most currently running apps on your mobile device as they might be keeping the radio link alive in the background. On Android 4 this is done under Settings | Apps | Running. I had to stop Google Services.
You can determine if the radio link promotion delay occurs based on whether any of the times are greater than 2 seconds. Here’s a key:
- no 2 second times
- If all of the times are less than 2 seconds then the radio link was already active. You can create this result by loading the page multiple times in quick succession. All the times should be pretty fast because you have a radio link, the DNS resolution is cached, and you have a persistent connection to the web server.
- dns > 2 seconds
- If you wait 10-20 seconds (and closed all background apps) the radio link gets demoted. At this point clicking on one of the buttons to open the test page on another domain will force a DNS lookup. Normally the DNS lookup should take a few hundred milliseconds, but if the radio link needs to be promoted the DNS time jumps to 2000+ milliseconds. This page is hosted on three different domains. If you use all three pages thus caching all three DNS resolutions, the only way I know of to clear the DNS cache is to power cycle the phone.
- connect > 2 seconds
- If you allow the radio link to be demoted by waiting 10-20 seconds and reload the page (or click the button for the same page) you might see the connect time is greater than 2 seconds. This happens when the DNS is cached but there’s no persistent connection to the server. This is harder to reproduce – it depends on the browser’s policy for closing persistent connections.
- ttfb > 2 seconds
- If the radio link is demoted, the DNS is cached, and there’s a persistent connection to the server you’ll see the time-to-first-byte (ttfb) is greater than 2 seconds. This is what happens most frequently when you load the same page multiple times with a 10-20 second gap in-between.
It’s important that developers focusing on performance be aware of the impact of radio link promotion on nav timing for mobile traffic so you don’t waste time solving the wrong problem: If you’re gathering RUM data via nav timing and see slow DNS times, you might think about investing in your DNS infrastructure – even though those slow DNS times might be caused by radio link promotion. Similarly, if you see long connection times it might not make sense to investigate how your servers manage persistent connections. And slow time-to-first-byte values may or may not indicate a backend app layer performance problem.
My website doesn’t generate enough mobile traffic to verify this theory, but I believe that websites with enough mobile nav timing data will see bimodal distributions of their timing data for dns, connection, and ttfb where the modes are ~2 seconds apart. If anyone has enough data (you know who you are) please take a look and comment below. It might be possible to develop heuristics that help us determine when radio link delays are having an impact. I’d love to get some stats on the percentage of page views that incur this delay.
Frontend SPOF in Beijing
This past December I contributed an article called Frontend SPOF in Beijing to PerfPlanet’s Performance Calendar. I hope that everyone who reads my blog also read the Performance Calendar – it’s an amazing collection of web performance articles and gurus. But in case you don’t I’m cross-posting it here. I saw a great presentation from Pat Meenan about frontend SPOF and want to raise awareness around this issue. This post contains some good insights.
Make sure to read PerfPlanet – it’s a great aggregator of WPO blog posts.
Now – flash back to December 2011…
I’m at Velocity China in Beijing as I write this article for the Performance Calendar. Since this is my second time to Beijing I was better prepared for the challenges of being behind the Great Firewall. I knew I couldn’t access popular US websites like Google, Facebook, and Twitter, but as I did my typical surfing I was surprised at how many other websites seemed to be blocked.
Business Insider
It didn’t take me long to realize the problem was frontend SPOF – when a frontend resource (script, stylesheet, or font file) causes a page to be unusable. Some pages were completely blank, such as Business Insider:
Firebug’s Net Panel shows that anywhere.js is taking a long time to download because it’s coming from platform.twitter.com – which is blocked by the firewall. Knowing that scripts block rendering of all subsequent DOM elements, we form the hypothesis that anywhere.js is being loaded in blocking mode in the HEAD. Looking at the HTML source we see that’s exactly what is happening:
<head>
...
<!-- Twitter Anywhere -->
<script src="https://platform.twitter.com/anywhere.js?id=ZV0...&v=1" type="text/javascript"></script>
<!-- / Twitter Anywhere -->
...
</head>
...
<body>
If anywhere.js had been loaded asynchronously this wouldn’t happen. Instead, since anywhere.js is loaded the old way with <SCRIPT SRC=..., it blocks all the DOM elements that follow which in this case is the entire BODY of the page. If we wait long enough the request for anywhere.js times out and the page begins to render. How long does it take for the request to timeout? Looking at the “after†screenshot of Business Insider we see it takes 1 minute and 15 seconds for the request to timeout. That’s 1 minute and 15 seconds that the user is left staring at a blank white screen waiting for the Twitter script!
CNET
CNET has a slightly different experience; the navigation header is displayed but the rest of the page is blocked from rendering:
Looking in Firebug we see that wrapper.js from cdn.eyewonder.com is “pending†– this must be another domain that’s blocked by the firewall. Based on where the rendering stops our guess is that the wrapper.js SCRIPT tag is immediately after the navigation header and is loaded in blocking mode thus preventing the rest of the page from rendering. The HTML confirms that this is indeed what’s happening:
<header>
...
</header>
<script src="http://cdn.eyewonder.com/100125/771933/1592365/wrapper.js"></script>
<div id="rb_wrap">
<div id="rb_content"> <div id="contentMain">
O’Reilly Radar
Everyday I visit O’Reilly Radar to read Nat Torkington’s Four Short Links. Normally Nat’s is one of many stories on the Radar front page, but going there from Beijing shows a page with only one story:
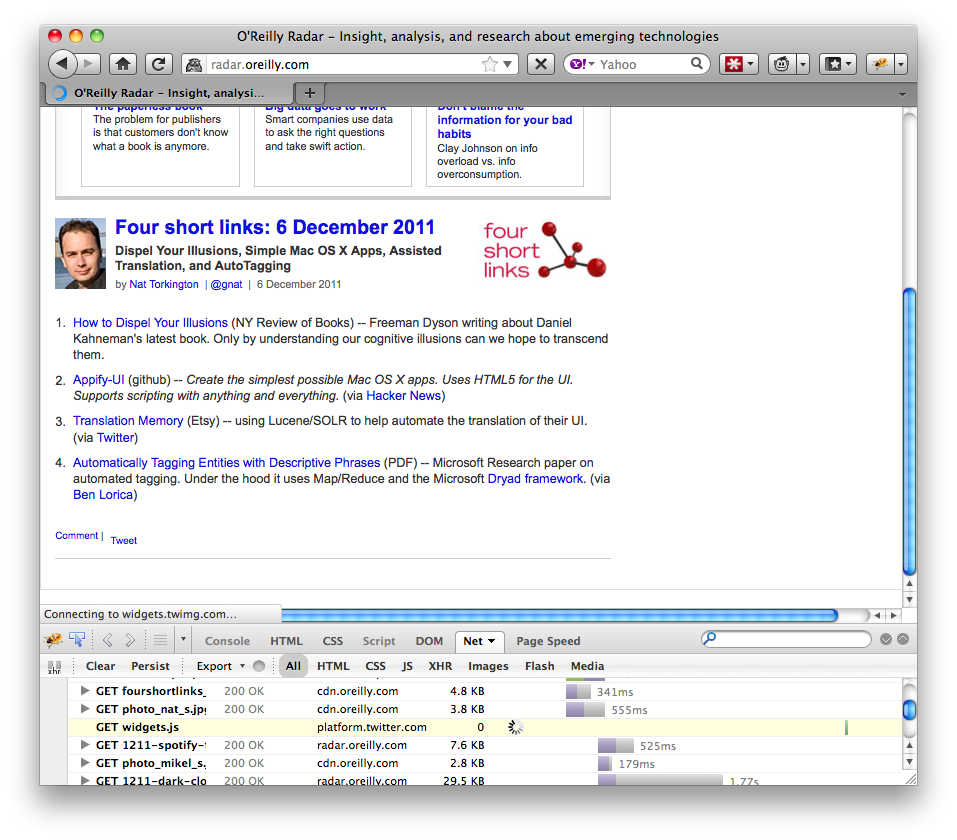
At the bottom of this first story there’s supposed to be a Tweet button. This button is added by the widgets.js script fetched from platform.twitter.com which is blocked by the Great Firewall. This wouldn’t be an issue if widgets.js was fetched asynchronously, but sadly a peek at the HTML shows that’s not the case:
<a href="...">Comment</a> | <span class="social-counters"> <span class="retweet"> <a href="http://twitter.com/share" class="twitter-share-button" data-count="horizontal" data-url="http://radar.oreilly.com/2011/12/four-short-links-6-december-20-1.html" data-text="Four short links: 6 December 2011" data-via="radar" data-related="oreillymedia:oreilly.com">Tweet</a> <script src="http://platform.twitter.com/widgets.js" type="text/javascript"></script> </span>
The cause of frontend SPOF
One possible takeaway from these examples might be that frontend SPOF is specific to Twitter and eyewonder and a few other 3rd party widgets. Sadly, frontend SPOF can be caused by any 3rd party widget, and even from the main website’s own scripts, stylesheets, or font files.
Another possible takeaway from these examples might be to avoid 3rd party widgets that are blocked by the Great Firewall. But the Great Firewall isn’t the only cause of frontend SPOF – it just makes it easier to reproduce. Any script, stylesheet, or font file that takes a long time to return has the potential to cause frontend SPOF. This typically happens when there’s an outage or some other type of failure, such as an overloaded server where the HTTP request languishes in the server’s queue for so long the browser times out.
The true cause of frontend SPOF is loading a script, stylesheet, or font file in a blocking manner. The table in my frontend SPOF blog post shows when this happens. It’s really the website owner who controls whether or not their site is vulnerable to frontend SPOF. So what’s a website owner to do?
Avoiding frontend SPOF
The best way to avoid frontend SPOF is to load scripts asynchronously. Many popular 3rd party widgets do this by default, such as Google Analytics, Facebook, and Meebo. Twitter also has an async snippet for the Tweet button that O’Reilly Radar should use. If the widgets you use don’t offer an async version you can try Stoyan’s Social button BFFs async pattern.
Another solution is to wrap your widgets in an iframe. This isn’t always possible, but in two of the examples above the widget is eventually served in an iframe. Putting them in an iframe from the start would have avoided the frontend SPOF problems.
For the sake of brevity I’ve focused on solutions for scripts. Solutions for font files can be found in my @font-face and performance blog post. I’m not aware of much research on loading stylesheets asynchronously. Causing too many reflows and FOUC are concerns that need to be addressed.
Call to action
Business Insider, CNET, and O’Reilly Radar all have visitors from China, and yet the way their pages are constructed delivers a bad user experience where most if not all of the page is blocked for more than a minute. This isn’t a P2 frontend JavaScript issue. This is an outage. If the backend servers for these websites took 1 minute to send back a response, you can bet the DevOps teams at Business Insider, CNET, and O’Reilly wouldn’t sleep until the problem was fixed. So why is there so little concern about frontend SPOF?
Frontend SPOF doesn’t get much attention – it definitely doesn’t get the attention it deserves given how easily it can bring down a website. One reason is it’s hard to diagnose. There are a lot of monitors that will start going off if a server response time exceeds 60 seconds. And since all that activity is on the backend it’s easier to isolate the cause. Is it that pagers don’t go off when clientside page load times exceed 60 seconds? That’s hard to believe, but perhaps that’s the case.
Perhaps it’s the way page load times are tracked. If you’re looking at worldwide medians, or even averages, and China isn’t a major audience your page load time stats might not exceed alert levels when frontend SPOF happens. Or maybe page load times are mostly tracked using synthetic testing, and those user agents aren’t subjected to real world issues like the Great Firewall.
One thing website owners can do is ignore frontend SPOF until it’s triggered by some future outage. A quick calculation shows this is a scary choice. If a 3rd party widget has a 99.99% uptime and a website has five widgets that aren’t async, the probability of frontend SPOF is 0.05%. If we drop uptime to 99.9% the probability of frontend SPOF climbs to 0.5%. Five widgets might be high, but remember that “third party widget†includes ads and metrics. Also, the website’s own resources can cause frontend SPOF which brings the number even higher. The average website today contains 14 scripts any of which could cause frontend SPOF if they’re not loaded async.
Frontend SPOF is a real problem that needs more attention. Website owners should use async snippets and patterns, monitor real user page load times, and look beyond averages to 95th percentiles and standard deviations. Doing these things will mitigate the risk of subjecting users to the dreaded blank white page. A chain is only as strong as its weakest link. What’s your website’s weakest link? There’s a lot of focus on backend resiliency. I’ll wager your weakest link is on the frontend.
[Originally posted as part of PerfPlanet’s Performance Calendar 2011.]
Cache compressed? or uncompressed?
My previous blog post, Cache them if you can, suggests that current cache sizes are too small – especially on mobile.
Given this concern about cache size a relevant question is:
If a response is compressed, does the browser save it compressed or uncompressed?
Compression typically reduces responses by 70%. This means that a browser can cache 3x as many compressed responses if they’re saved in their compressed format.
Note that not all responses are compressed. Images make up the largest number of resources but shouldn’t be compressed. On the other hand, HTML documents, scripts, and stylesheets should be compressed and account for 30% of all requests. Being able to save 3x as many of these responses to cache could have a significant impact on cache hit rates.
It’s difficult and time-consuming to determine whether compressed responses are saved in compressed format. I created this Caching Gzip Test page to help determine browser behavior. It has two 200 KB scripts – one is compressed down to ~148 KB and the other is uncompressed. (Note that this file is random strings so the compression savings is only 25% as compared to the typical 70%.) After clearing the cache and loading the test page if the total cache disk size increases ~348 KB it means the browser saves compressed responses as compressed. If the total cache disk size increases ~400 KB it means compressed responses are saved uncompressed.
The challenging part of this experiment is finding where the cache is stored and measuring the response sizes. Firefox, Chrome, and Opera save responses as files and were easy to measure. For IE on Windows I wasn’t able to access the individual cache files (admin permissions?) but was able to measure the sizes based on the properties of the Temporary Internet Files folder. Safari saves all responses in Cache.db. I was able to see the incremental increase by modifying the experiment to be two pages: the compressed response and the uncompressed response. You can see the cache file locations and full details in the Caching Gzip Test Results page.
Here are the results for top desktop browsers:
| Browser | Compressed responses cached compressed? |
max cache size |
|---|---|---|
| Chrome 17 | yes | 320 MB* |
| Firefox 11 | yes | 850 MB* |
| IE 8 | no | 50 MB |
| IE 9 | no | 250 MB |
| Safari 5.1.2 | no | unknown |
| Opera 11 | yes | 20 MB |
* Chrome and Firefox cache size is a percentage of available disk space. Chrome is capped at 320 MB. I don’t know what Firefox’s cap is; on my laptop with 50 GB free the cache size is 830 MB.
We see that Chrome 17, Firefox 11, and Opera 11 store compressed responses in compressed format, while IE 8&9 and Safari 5 save them uncompressed. IE 8&9 have smaller cache sizes, so the fact that they uncompress responses before caching further reduces the number of responses that can be cached.
What’s the best choice? It’s possible that reading cached responses is faster if they’re already uncompressed. That would be a good next step to explore. I wouldn’t prejudge IE’s choice when it comes to performance on Windows. But it’s clear that saving compressed responses in compressed format increases the number of responses that can be cached, and this increases cache hit rates. What’s even clearer is that browsers don’t agree on the best answer. Should they?
Cache them if you can
“The fastest HTTP request is the one not made.”
I always smile when I hear a web performance speaker say this. I forget who said it first, but I’ve heard it numerous times at conferences and meetups over the past few years. It’s true! Caching is critical for making web pages faster. I’ve written extensively about caching:
- Call to improve browser caching
- (lack of) Caching for iPhone Home Screen Apps
- Redirect caching deep dive
- Mobile cache file sizes
- Improving app cache
- Storager case study: Bing, Google
- App cache & localStorage survey
- HTTP Archive: max-age
Things are getting better – but not quickly enough. The chart below from the HTTP Archive shows that the percentage of resources that are cacheable has increased 10% during the past year (from 42% to 46%). Over that same time the number of requests per page has increased 12% and total transfer size has increased 24% (chart).
Perhaps it’s hard to make progress on caching because the problem doesn’t belong to a single group – responsibility spans website owners, third party content providers, and browser developers. One thing is certain – we have to do a better job when it comes to caching.Â
I’ve gathered some compelling statistics over the past few weeks that illuminate problems with caching and point to some next steps. Here are the highlights:
- 55% of resources don’t specify a max-age value
- 46% of the resources without any max-age remained unchanged over a 2 week period
- some of the most popular resources on the Web are only cacheable for an hour or two
- 40-60% of daily users to your site don’t have your resources in their cache
- 30% of users have a full cache
- for users with a full cache, the median time to fill their cache is 4 hours of active browsing
Read on to understand the full story.
My kingdom for a max-age header
Many of the caching articles I’ve written address issues such as size & space limitations, bugs with less common HTTP headers, and outdated purging logic. These are critical areas to focus on. But the basic function of caching hinges on websites specifying caching headers for their resources. This is typically done using max-age in the Cache-Control response header. This example specifies that a response can be read from cache for 1 year:
Cache-Control: max-age=31536000
Since you’re reading this blog post you probably already use max-age, but the following chart from the HTTP Archive shows that 55% of resources don’t specify a max-age value. This translates to 45 of the average website’s 81 resources needing a HTTP request even for repeat visits.
Missing max-age != dynamic
Why do 55% of resources have no caching information? Having looked at caching headers across thousands of websites my first guess is lack of awareness – many website owners simply don’t know about the benefits of caching. An alternative explanation might be that many resources are dynamic (JSON, ads, beacons, etc.) and shouldn’t be cached. Which is the bigger cause – lack of awareness or dynamic resources? Luckily we can quantify the dynamicness of these uncacheable resources using data from the HTTP Archive.
The HTTP Archive analyzes the world’s top ~50K web pages on the 1st and 15th of the month and records the HTTP headers for every resource. Using this history it’s possible to go back in time and quantify how many of today’s resources without any max-age value were identical in previous crawls. The data for the chart above (showing 55% of resources with no max-age) was gathered on Feb 15 2012. The chart below shows the percentage of those uncacheable resources that were identical in the previous crawl on Feb 1 2012. We can go back even further and see how many were identical in both the Feb 1 2012 and the Jan 15 2012 crawls. (The HTTP Archive doesn’t save response bodies so the determination of “identical” is based on the resource having the exact same URL, Last-Modified, ETag, and Content-Length.)

46% of the resources without any max-age remained unchanged over a 2 week period. This works out to 21 resources per page that could have been read from cache without any HTTP request but weren’t. Over a 1 month period 38% are unchanged – 17 resources per page.
This is a significant missed opportunity. Here are some popular websites and the number of resources that were unchanged for 1 month but did not specify max-age:
- http://www.toyota.jp/ – 172 resources without max-age & unchanged for 1 month
- http://www.sfgate.com/ – 133
- http://www.hasbro.com/ – 122
- http://www.rakuten.co.jp/ – 113
- http://www.ieee.org/ – 97
- http://www.elmundo.es/ – 80
- http://www.nih.gov/ – 76
- http://www.frys.com/ – 68
- http://www.foodnetwork.com/ – 66
- http://www.irs.gov/ – 58
- http://www.ca.gov/ – 53
- http://www.oracle.com/ – 52
- http://www.blackberry.com/ – 50
Recalling that “the fastest HTTP request is the one not made”, this is a lot of unnecessary HTTP traffic. I can’t prove it, but I strongly believe this is not intentional – it’s just a lack of awareness. The chart below reinforces this belief – it shows the percentage of resources (both cacheable and uncacheable) that remain unchanged starting from Feb 15 2012 and going back for one year.
The percentage of resources that are unchanged is nearly the same when looking at all resources as it is for only uncacheable resources: 44% vs. 46% going back 2 weeks and 35% vs. 38% going back 1 month. Given this similarity in “dynamicness” it’s likely that the absence of max-age has nothing to do with the resources themselves and is instead caused by website owners overlooking this best practice.
3rd party content
If a website owner doesn’t make their resources cacheable, they’re just hurting themselves (and their users). But if a 3rd party content provider doesn’t have good caching behavior it impacts all the websites that embed that content. This is both bad a good. It’s bad in that one uncacheable 3rd party resource can impact multiple sites. The good part is that shifting 3rd party content to adopt good caching practices also has a magnified effect.
So how are we doing when it comes to caching 3rd party content? Below is a list of the top 30 most-used resources according to the HTTP Archive. These are the resources that were used the most across the world’s top 50K web pages. The max-age value (in hours) is also shown.
- http://www.google-analytics.com/ga.js (2 hours)
- http://ssl.gstatic.com/s2/oz/images/stars/po/Publisher/sprite2.png (8760 hours)
- http://pagead2.googlesyndication.com/pagead/js/r20120208/r20110914/show_ads_impl.js (336 hours)
- http://pagead2.googlesyndication.com/pagead/render_ads.js (336 hours)
- http://pagead2.googlesyndication.com/pagead/show_ads.js (1 hour)
- https://apis.google.com/_/apps-static/_/js/gapi/gcm_ppb,googleapis_client,plusone/[…] (720 hours)
- http://pagead2.googlesyndication.com/pagead/osd.js (24 hours)
- http://pagead2.googlesyndication.com/pagead/expansion_embed.js (24 hours)
- https://apis.google.com/js/plusone.js (1 hour)
- http://googleads.g.doubleclick.net/pagead/drt/s?safe=on (1 hour)
- http://static.ak.fbcdn.net/rsrc.php/v1/y7/r/ql9vukDCc4R.png (3825 hours)
- http://connect.facebook.net/rsrc.php/v1/yQ/r/f3KaqM7xIBg.swf (164 hours)
- https://ssl.gstatic.com/s2/oz/images/stars/po/Publisher/sprite2.png (8760 hours)
- https://apis.google.com/_/apps-static/_/js/gapi/googleapis_client,iframes_styles[…] (720 hours)
- http://static.ak.fbcdn.net/rsrc.php/v1/yv/r/ZSM9MGjuEiO.js (8742 hours)
- http://static.ak.fbcdn.net/rsrc.php/v1/yx/r/qP7Pvs6bhpP.js (8699 hours)
- https://plusone.google.com/_/apps-static/_/ss/plusone/[…] (720 hours)
- http://b.scorecardresearch.com/beacon.js (336 hours)
- http://static.ak.fbcdn.net/rsrc.php/v1/yx/r/lP_Rtwh3P-S.css (8710 hours)
- http://static.ak.fbcdn.net/rsrc.php/v1/yA/r/TSn6F7aukNQ.js (8760 hours)
- http://static.ak.fbcdn.net/rsrc.php/v1/yk/r/Wm4bpxemaRU.js (8702 hours)
- http://static.ak.fbcdn.net/rsrc.php/v1/yZ/r/TtnIy6IhDUq.js (8699 hours)
- http://static.ak.fbcdn.net/rsrc.php/v1/yy/r/0wf7ewMoKC2.css (8699 hours)
- http://static.ak.fbcdn.net/rsrc.php/v1/yO/r/H0ip1JFN_jB.js (8760 hours)
- http://platform.twitter.com/widgets/hub.1329256447.html (87659 hours)
- http://static.ak.fbcdn.net/rsrc.php/v1/yv/r/T9SYP2crSuG.png (8699 hours)
- http://platform.twitter.com/widgets.js (1 hour)
- https://plusone.google.com/_/apps-static/_/js/plusone/[…] (720 hours)
- http://pagead2.googlesyndication.com/pagead/js/graphics.js (24 hours)
- http://s0.2mdn.net/879366/flashwrite_1_2.js (720 hours)
There are some interesting patterns.
- simple URLs have short cache times – Some resources have very short cache times, e.g., ga.js (1), show_ads.js (5), and twitter.com/widgets.js (27). Most of the URLs for these resources are very simple (no querystring or URL “fingerprints”) because these resource URLs are part of the snippet that website owners paste into their page. These “bootstrap” resources are given short cache times because there’s no way for the resource URL to be changed if there’s an emergency fix – instead the cached resource has to expire in order for the emergency update to be retrieved.
- long URLs have long cache times – Many 3rd party “bootstrap” scripts dynamically load other resources. These code-generated URLs are typically long and complicated because they contain some unique fingerprinting, e.g., http://pagead2.googlesyndication.com/pagead/js/r20120208/r20110914/show_ads_impl.js (3) and http://platform.twitter.com/widgets/hub.1329256447.html (25). If there’s an emergency change to one of these resources, the fingerprint in the bootstrap script can be modified so that a new URL is requested. Therefore, these fingerprinted resources can have long cache times because there’s no need to rev them in the case of an emergency fix.
- where’s Facebook’s like button? – Facebook’s like.php and likebox.php are also hugely popular but aren’t in this list because the URL contains a querystring that differs across every website. Those resources have an even more aggressive expiration policy compared to other bootstrap resources – they use
no-cache, no-store, must-revalidate. Once the like[box] bootstrap resource is loaded, it loads the other required resources: lP_Rtwh3P-S.css (19), TSn6F7aukNQ.js (20), etc. Those resources have long URLs and long cache times because they’re generated by code, as explained in the previous bullet. - short caching resources are often async – The fact that bootstrap scripts have short cache times is good for getting emergency updates, but is bad for performance because they generate many Conditional GET requests on subsequent requests. We all know that scripts block pages from loading, so these Conditional GET requests can have a significant impact on the user experience. Luckily, some 3rd party content providers are aware of this and offer async snippets for loading these bootstrap scripts mitigating the impact of their short cache times. This is true for ga.js (1), plusone.js (9), twitter.com/widgets.js (27), and Facebook’s like[box].php.
These extremely popular 3rd party snippets are in pretty good shape, but as we get out of the top widgets we quickly find that these good caching patterns degrade. In addition, more 3rd party providers need to support async snippets.
Cache sizes are too small
In January 2007 Tenni Theurer and I ran an experiment at Yahoo! to estimate how many users had a primed cache. The methodology was to embed a transparent 1×1 image in the page with an expiration date in the past. If users had the expired image in their cache the browser would issue a Conditional GET request and receive a 304 response (primed cache). Otherwise they’d get a 200 response (empty cache). I was surprised to see that 40-60% of daily users to the site didn’t have the site’s resources in their cache and 20% of page views were done without the site’s resources in the cache.
Numerous factors contribute to this high rate of unique users missing the site’s resources in their cache, but I believe the primary reason is small cache sizes. Browsers have increased the size of their caches since this experiment was run, but not enough. It’s hard to test browser cache size. Blaze.io’s article Understanding Mobile Cache Sizes shows results from their testing. Here are the max cache sizes I found for browsers on my MacBook Air. (Some browsers set the cache size based on available disk space, so let me mention that my drive is 250 GB and has 54 GB available.) I did some testing and searching to find max cache sizes for my mobile devices and IE.
- Chrome: 320 MB
- Internet Explorer 9: 250 MB
- Firefox 11: 830 MB (shown in about:cache)
- Opera 11: 20 MB (shown in Preferences | Advanced | History)
- iPhone 4, iOS 5.1: 30-35 MB (based on testing)
- Galaxy Nexus: 18 MB (based on testing)
I’m surprised that Firefox 11 has such a large cache size – that’s almost close to what I want. All the others are (way) too small. 18-35 MB on my mobile devices?! I have seven movies on my iPhone – I’d gladly trade Iron Man 2Â (1.82 GB) for more cache space.
Caching in the real world
In order to justify increasing browser cache sizes we need some statistics on how many real users overflow their cache. This topic came up at last month’s Velocity Summit where we had representatives from Chrome, Internet Explorer, Firefox, Opera, and Silk. (Safari was invited but didn’t show up.) Will Chan from the Chrome team (working on SPDY) followed-up with this post on Chromium cache metrics from Windows Chrome. These are the most informative real user cache statistics I’ve ever seen. I strongly encourage you to read his article.
Some of the takeaways include:
- ~30% of users have a full cache (capped at 320 MB)
- for users with a full cache, the median time to fill their cache is 4 hours of active browsing (20 hours of clock time)
- 7% of users clear their cache at least once per week
- 19% of users experience “fatal cache corruption” at least once per week thus clearing their cache
The last stat about cache corruption is interesting – I appreciate the honesty. The IE 9 team experienced something similar. In IE 7&8 the cache was capped at 50 MB based on tests showing increasing the cache size didn’t improve the cache hit rate. They revisited this surprising result in IE9 and found that larger cache sizes actually did improve the cache hit rate:
In IE9, we took a much closer look at our cache behaviors to better understand our surprising finding that larger caches were rarely improving our hit rate. We found a number of functional problems related to what IE treats as cacheable and how the cache cleanup algorithm works. After fixing these issues, we found larger cache sizes were again resulting in better hit rates, and as a result, we’ve changed our default cache size algorithm to provide a larger default cache.
Will mentions that Chrome’s 320 MB cap should be revisited. 30% seems like a low percentage for full caches, but could be accounted for by users that aren’t very active and active users that only visit a small number of websites (for example, just Gmail and Facebook). If possible I’d like to see these full cache statistics correlated with activity. It’s likely that user who account for the biggest percentage of web visits are more likely to have a full cache, and thus experience slower page load times.
Next steps
First, much of the data for this post came from the HTTP Archive, so I’d like to thank our sponsors: Google, Mozilla, New Relic, O’Reilly Media, Etsy, Strangeloop, dynaTrace Software, and Torbit.
The data presented here suggest a few areas to focus on:
Website owners need to increase their use of a Cache-Control max-age, and the max-age times need to be longer. 38% of resources were unchanged over a 1 month period, and yet only 11% of resources have a max-age value that high. Most resources, even if they change, can be refreshed by including a fingerprint in the URL specified in the HTML document. Only bootstrap scripts from 3rd parties should have short cache times (hours). Truly dynamic responses (JSON, etc.) should specify must-revalidate. A year from now rather than seeing 55% of resources without any max-age value we should see 55% cacheable for a month or more.
3rd party content providers need wider adoption of the caching and async behavior shown by the top Google, Twitter, and Facebook snippets.
Browser developers stand to bring the biggest improvements to caching. Increasing cache sizes is a likely win, especially for mobile devices. Data correlating cache sizes and user activity is needed. More intelligence around purging algorithms, such as IE 9’s prioritization based on mime type, will help when the cache fills up. More focus on personalization (what are the sites I visit most often?) would also create a faster user experience when users go to their favorite websites.
It’s great that the number of resources with caching headers grew 10% over the last year, but that just isn’t enough progress. We should really expect to double the number of resources that can be read from cache over the coming year. Just think about all those HTTP requests that can be avoided!
the Performance Golden Rule
Yesterday I did a workshop at Google Ventures for some of their portfolio companies. I didn’t know how much performance background the audience would have, so I did an overview of everything performance-related starting with my first presentations back in 2007. It was very nostalgic. It has been years since I talked about the best practices from High Performance Web Sites. I reviewed some of those early tips, like Make Fewer HTTP Requests, Add an Expires Header, and Gzip Components.
But I needed to go back even further. Thinking back to before Velocity and WPO existed, I thought I might have to clarify why I focus mostly on frontend performance optimizations. I found my slides that explained the Performance Golden Rule:
80-90% of the end-user response time is spent on the frontend.
Start there.
There were some associated slides that showed the backend and frontend times for popular websites, but the data was old and limited, so I decided to update it. Here are the results.
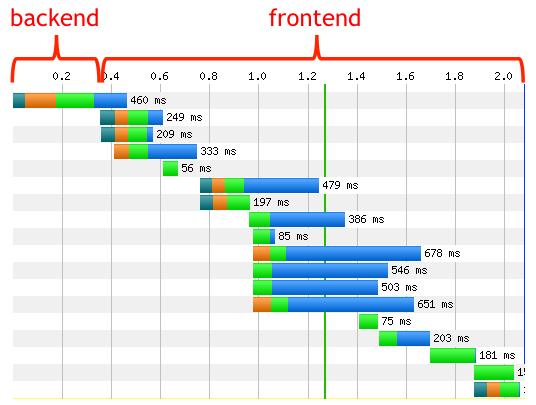
First is an example waterfall showing the backend/frontend split. This waterfall is for LinkedIn. The “backend” time is the time it takes the server to get the first byte back to the client. This typically includes the bulk of backend processing: database lookups, remote web service calls, stitching together HTML, etc. The “frontend” time is everything else. This includes obvious frontend phases like executing JavaScript and rendering the page. It also includes network time for downloading all the resources referenced in the page. I include this in the frontend time because there’s a great deal web developers can do to reduce this time, such as async script loading, concatenating scripts and stylesheets, and sharding domains.
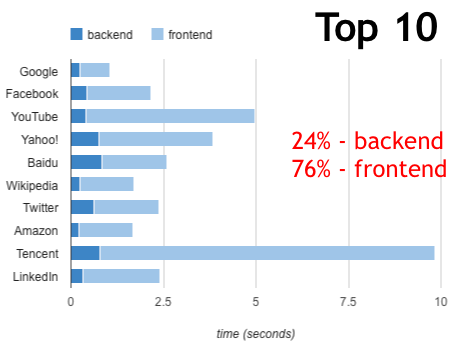
For some real world results I look at the frontend/backend split for Top 10 websites. The average frontend time is 76%, slightly lower than the 80-90% advertised in the Performance Golden Rule. But remember that these sites have highly optimized frontends, and two of them are search pages (not results) that have very few resources.
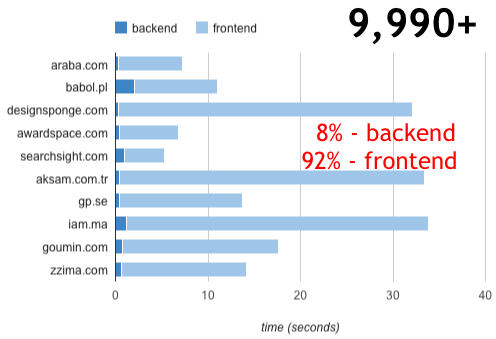
For a more typical view I looked at 10 sites ranked around 10,000. The frontend time is 92%, higher than the 76% of the Top 10 sites and even higher than the 80-90% suggested by the Performance Golden Rule.
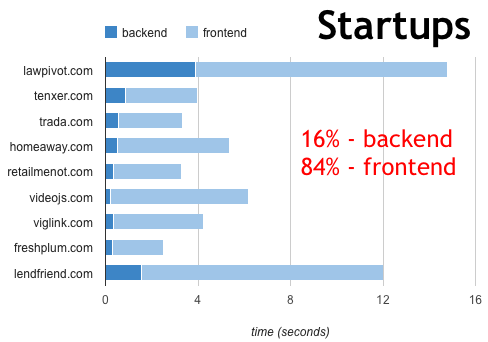
To bring this rule home to the attendees I showed the backend and frontend times for their websites. The frontend time was 84%. This helped me get their agreement that the longest pole in the tent was frontend performance and that was the place to focus.
Afterward I realized that I have timing information in the HTTP Archive. I generally don’t show these time measurements because I think real user metrics are more accurate, but I calculated the split across all 50,000 websites that are being crawled. The frontend time is 87%.
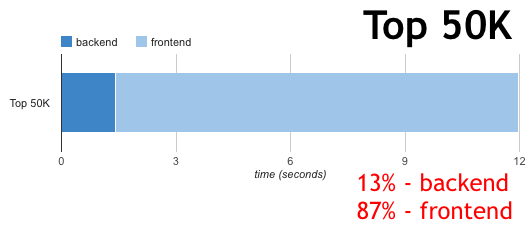
It’s great to have this updated information that shows the Performance Golden Rule is as accurate now as it was back in 2007, and points to the motivation for focusing on frontend optimizations. If you’re worried about availability and scalability, focus on the backend. But if you’re worried about how long users are waiting for your website to load focusing on the frontend is your best bet.
HTTP Archive: 2011 recap
I started the HTTP Archive back in October 2010. It’s hard to believe it’s been that long. The project is going well:
- The number of websites archived has grown from ~15K to ~55K. (Our goal for this year is 1M!)
- In May we partnered with Blaze.io to launch the HTTP Archive Mobile.
- In June we merged with the Internet Archive.
- Joining the Internet Archive allowed us to accept financial support from our incredible sponsors: Google, Mozilla, New Relic, O’Reilly Media, Etsy, Strangeloop, and dynaTrace Software. Last month Torbit became our newest sponsor.
- As of last week we’ve completely moved to our new data center, ISC.
I’m pleased with how the WPO community has contributed to make the HTTP Archive possible. The project wouldn’t have been possible without Pat Meenan and his ever impressive and growing WebPagetest framework. A number of people have contributed to the open source code including Jonathan Klein, Yusuke Tsutsumi, Carson McDonald, James Byers, Ido Green, Mike Pfirrmann, Guy Leech, and Stephen Hay.
This is our first complete calendar year archiving website statistics. I want to start a tradition of doing an annual recap of insights from the HTTP Archive.
2011 vs 2012
The most noticeable trend during 2011 was the size of websites and resources. Table 1 shows the transfer size of content types for the average website. For example, “379kB” is the total size of images downloaded for an average website. (Since the sample of websites changed during the year, these stats are based on the intersection trends for 11,910 websites that were in every batch run.)
| Table 1. Transfer Size by Content Type | |||
| Jan 2011 | Jan 2012 | change | |
|---|---|---|---|
| HTML | 31kB | 34kB | +10% |
| JavaScript | 110kB | 158kB | +44% |
| CSS | 26kB | 31kB | +19% |
| Images | 379kB | 459kB | +21% |
| Flash | 71kB | 64kB | -10% |
| total | 638kB | 773kB | +21% |
One takeaway from this data is that images make up a majority of the bytes downloaded for websites (59%). Also, images are the second fastest growing content type for desktop and the #1 fastest growing content type for mobile. These two observations highlight the need for more performance optimizations for images. Many websites would benefit from losslessly compressing their images with existing tools. WebP is another candidate for reducing image size.
A second takeaway is the tremendous growth in JavaScript size – up 44% over the course of the year. The amount of JavaScript grew more than twice as much as the next closest type of content (images). Parsing and executing JavaScript blocks the UI thread and makes websites slower. More JavaScript makes the problem worse. Downloading scripts also causes havoc with website performance, so the fact that the number of scripts on the average page grew from 11 to 13 is also a concern.
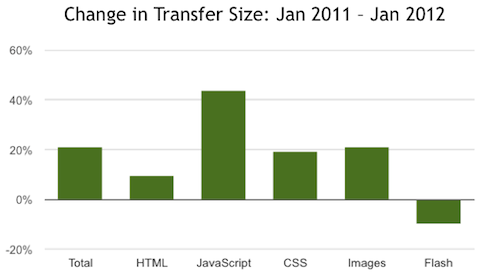
On a positive note, the amount of Flash being downloaded dropped 10%. Sadly, the number of sites using Flash only dropped from 44% to 43%, but at least those swfs are downloading faster.
Adoption of Best Practices
I personally love the HTTP Archive for tracking the adoption of web performance best practices. Some trends year-over-year include:
- The percent of resources that had caching headers grew from 42% to 46%. It’s great that the use of caching is increasing, but the fact that 54% of requests still don’t have any caching headers is a missed opportunity.
- Sites using the Google Libraries API jumped from 10% to 16%. Using a CDN with distributed locations and the ability to leverage caching across websites make this a positive for web performance.
- On the downside, websites with at least one redirect grew from 59% to 66%.
- Websites using custom fonts quadrupled from 2% to 8%. I’ve written about the performance dangers of custom fonts. Just today I did a performance analysis of Maui Rippers and discovered the reason the site didn’t render for 6+ seconds was a 280K font file.
It’s compelling to see how best practices are adopted by the top websites as compared to more mainstream websites. Table 2 shows various stats for the top 100 and top 1000 websites, as well as all 53,614 websites in the last batch run.
| Table 2. Best Practices for Top 100, Top 1000, All | |||
| Top 100 | Top 1000 | Â Â All | |
|---|---|---|---|
| total size | 509kB | 805kB | 962kB |
| total requests | 57 | 90 | 86 |
| caching headers | 70% | 58% | 42% |
| use Flash | 34% | 49% | 48% |
| custom fonts | 6% | 9% | 8% |
| redirects | 57% | 69% | 65% |
The overall trend shows that performance best practices drop dramatically outside of the Top 100 websites. The most significant are:
- Total size goes from 509 kB to 805 kB to 962 kB.
- Total number of HTTP requests is similar growing from 57 to 90 and a small decrease to 86 requests.
- The use of future caching headers is high for the top 100 at 70%, but then drops to 58% and even further to 42%.
The Web has a long tail. It’s not enough for the top sites to have high performance. WPO best practices need to find their way to the next tier of websites and on to the brick-and-mortar, mom-and-pop, and niche sites that we all visit. More awareness, more tools, and more automation are the answer. I can’t wait to read the January 2013 update to this blog post and see how we did. Here’s to a faster and stronger Web in 2012!
JavaScript Performance
Last night I spoke at the San Francisco JavaScript Meetup. I gave a brand new talk called JavaScript Performance that focuses on script loading and async snippets. The snippet example I chose was the Google Analytics async snippet. The script-loading part of that snippet is only six lines, but a lot of thought and testing went into it. It’s a great prototype to use if you’re creating your own async snippet. I’ll tweet if/when the video of my talk comes out, but in the meantime the slides (Slideshare, pptx) do a good job of relaying the information.
There are two new data points from the presentation that I want to call out in this blog post.
Impact of JavaScript
The presentation starts by suggesting that JavaScript is typically the #1 place to look for making a website faster. My anecdotal experience supports this hypothesis, but I wanted to try to do some quantitative verification. As often happens, I turned to WebPagetest.
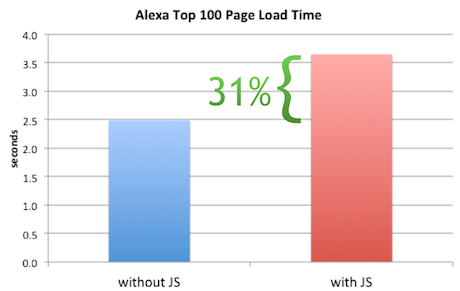
I wanted to test the Alexa Top 100 URLs with and without JavaScript. To load these sites withOUT JavaScript I used WebPagetest’s “block” feature. I entered “.js” which tells WebPagetest to ignore every HTTP request with a URL that contains that string. Each website was loaded three times and the median page load time was recorded. I then found the median of all these median page load times.
The median page load with JavaScript is 3.65 seconds. Without JavaScript the page load time drops to 2.487 seconds – a 31% decrease. (Here’s the data in WebPagetest: with JavaScript, without JavaScript.) It’s not a perfect analysis: Some script URLs don’t contain “.js” and inline script blocks are still executed. I think this is a good approximation and I hope to do further experiments to corroborate this finding.
Async Execution Order & Onload
The other new infobyte has to do with the async=true line from the GA async snippet. The purpose of this line is to cause the ga.js script to not block other async scripts from being executed. It turns out that some browsers preserve the execution order of scripts loaded using the insertBefore technique, which is the technique used in the GA snippet:
ga.type = ‘text/javascript’;
ga.async = true;
ga.src = (‘https:’ == document.location.protocol ? ‘https://ssl’ : ‘http://www’) + ‘.google-analytics.com/ga.js’;
var s = document.getElementsByTagName(‘script’)[0];
s.parentNode.insertBefore(ga, s);
Preserving execution order of async scripts makes the page slower. If the first async script takes a long time to download, all the other async scripts are blocked from executing, even if they download sooner. Executing async scripts immediately as they’re downloaded results in a faster page load time. I knew old versions of Firefox had this issue, and setting async=true fixed the problem. But I wanted to see if any other browsers also preserved execution order of async scripts loaded this way, and whether setting async=true worked.
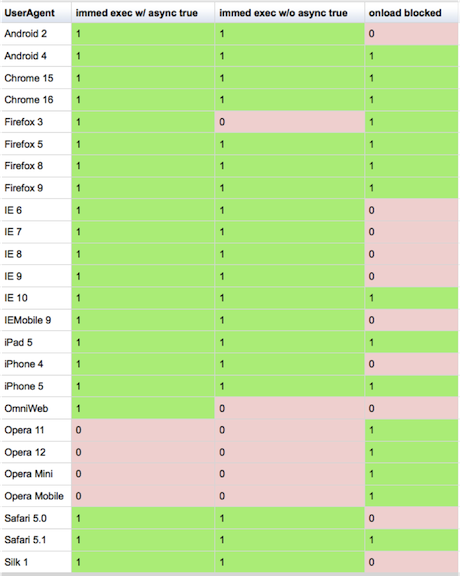
To answer these questions I created a Browserscope user test called Async Script Execution Order. I tweeted the test URL and got 348 results from 60+ different browsers. (Thanks to all the people that ran the test! I still need results from more mobile browsers so please run the test if you have a browser that’s not covered.) Here’s a snapshot of the results:
The second column shows the results of loading two async scripts with the insertBefore pattern AND setting async=true. The third column shows the results if async is NOT set to true. Green means the scripts execute immediately (good) and red indicates that execution order is preserved (bad).
The results show that Firefox 3.6, OmniWeb 622, and all versions of Opera preserve execution order. Setting async=true successfully makes the async scripts execute immediately in Firefox 3.6 and OmniWeb 622, but not in Opera. Although this fix only applies to a few browsers, its small cost makes it worthwhile. Also, if we get results for more mobile browsers I would expect to find a few more places where the fix is necessary.
I also tested whether these insertBefore-style async scripts block the onload event. The results, shown in the fourth column, are mixed if we include older browsers, but we see that newer browsers generally block the onload event when loading these async scripts – this is true in Android, Chrome, Firefox, iOS, Opera, Safari, and IE 10. This is useful to know if you wonder why you’re still seeing long page load times even after adopting async script loading. It also means that code in your onload handler can’t reliably assume async scripts are loaded because of the many browsers out there that do not block the onload event, including IE 6-9.
And a final shout out to the awesomeness of the Open Source community that makes tools like WebPagetest and Browserscope available – thanks Pat and Lindsey!
Silk, iPad, Galaxy comparison
In my previous blog post I announced Loadtimer – a mobile test harness for measuring page load times. I was motivated to create Loadtimer because recent reviews of the Kindle Fire lacked the quantified data and reliable test procedures needed to compare browser performance.
Most performance evaluations of Silk that have come out since its launch have two conclusions:
- Silk is faster when acceleration is turned off.
- Silk is slow compared to other tablets.
Let’s poke at those more rigorously using Loadtimer.
Test Description
In this test I’m going to compare the following tablets: Kindle Fire (with acceleration on and off), iPad 1, iPad 2, Galaxy 7.0, and Galaxy 10.1.
The test is based on how long it takes for web pages to load on each device. I picked 11 URLs that are top US websites:
- http://www.yahoo.com/
- http://www.amazon.com/
- http://en.wikipedia.org/wiki/Flowers
- http://www.craigslist.com/
- http://www.ebay.com/
- http://www.linkedin.com/
- http://www.bing.com/search?q=flowers
- http://www.msn.com/
- http://www.engadget.com/
- http://www.cnn.com/
- http://www.reddit.com/
Some popular choices (Google, YouTube, and Twitter) weren’t selected because they have framebusting code and so don’t work in Loadtimer’s iframe-based test harness.
The set of 11 URLs were loaded 9 times on each device. The set of URLs was randomized for each run. All the tests were conducted on my home wifi over a Comcast cable modem. (Check out this photo of my test setup.) All the tests were done at the same time of day over a 3 hour period. I did one test at a time to avoid bandwidth contention, and rotated through the devices doing one run at a time. I cleared the cache between each run.
Apples and Oranges
The median page load time for each URL on each device is shown in the Loadtimer Results page. It’s a bit complicated to digest. The fastest load time is shown in green and the slowest is red – that’s easy. The main complication is that not every device got the same version of a given URL. Cells in the table that are shaded with a gray background were cases where the device received a mobile version of the URL. Typically (but not always) the mobile version is lighter than the desktop version (fewer requests, fewer bytes, less JavaScript, etc.) so it’s not valid to do a heads up comparison of page load times between desktop and mobile versions.
Out of 11 URLs, the Galaxy 7.0 received 6 that were mobile versions. The Galaxy 10.1 and Silk each received 2 mobile versions, and the iPads each had only one mobile version across the 11 URLs.
In order to gauge the difference between the desktop and mobile versions, the results table shows the number of resources in each page. eBay, for example, had 64 resources in the desktop version, but only 18-22 in the mobile version. Not surprisingly, the three tablets that received the lighter mobile version had the fastest page load times. (If a mobile version was faster than the fastest desktop version, I show it in non-bolded green with a gray background.)
This demonstrates the importance of looking at the context of what’s being tested. In the comparisons below we’ll make sure to keep the desktop vs mobile issue in mind.
Silk vs Silk
Let’s start making some comparisons. The results table is complicated when all 6 rows are viewed. The checkboxes are useful for making more focused comparisons. The Silk (accel off) and Silk (accel on) results show that indeed Silk performed better with acceleration turned off for every URL. This is surprising, but there are some things to note.
First, this is the first version of Silk. Jon Jenkins, Director of Software Development for Silk, spoke at Velocity Europe a few weeks back. In his presentation he shows different places where the split in Silk’s split architecture could happen (slides 26-28). He also talked about the various types of optimizations that are part of the acceleration. Although he didn’t give specifics, it’s unlikely that all of those architectural pieces and performance optimizations have been deployed in this first version of Silk. The test results show that some of the obvious optimizations, such as concatenating scripts, aren’t happening when acceleration is on. I expect we’ll see more optimizations rolled out during the Silk release cycle, just as we do for other browsers.
A smaller but still important issue is that although the browser cache was cleared between tests, the DNS cache wasn’t cleared. When acceleration is on there’s only one DNS lookup needed – the one to Amazon’s server. When acceleration is off Silk has to do a DNS lookup for every unique domain – an average of 13 domains per page. Having all of those DNS lookups cached gives an unfair advantage to the “acceleration off” page load times.
I’m still optimistic about the performance gains we’ll see as Silk’s split architecture matures, but for the remainder of this comparison we’ll use Silk with acceleration off since that performed best.
Silk vs iPad
I had both an iPad 1 and iPad 2 at my disposal so included both in the study. The iPad 1 was the slowest across all 11 URLs so I restricted the comparison to Silk (accel off) and iPad 2.
The results are mixed with iPad 2 being faster for most but not all URLs. The iPad 2 is fastest in 7 URLs. Silk is fastest in 3 URLs. One URL (eBay) is apples and oranges since Silk gets a mobile version of the site (18 resources compared to 64 resources for the desktop version).
Silk vs Galaxy
Comparing the Galaxy 7.0 to any other tablet is not fair since Galaxy 7.0 receives a lighter mobile version in 6 of 11 URLs. The Galaxy 7.0 has the slowest page load time in 3 of the 4 URLs where it, Galaxy 10.1, and Silk all receive the desktop version. Since it’s slower head-to-head and has mobile versions in the other URLs, I’ll focus on comparing Silk to the Galaxy 10.1.
Silk has the fastest page load time in 7 URLs. The Galaxy 10.1 is faster in 3 URLs. One URL is mixed as Silk gets a mobile version (18 resources) while the Galaxy 10.1 gets a desktop version (64 resources).
 Takeaways
These results show that, as strange as it might sound, Silk appears to be faster when acceleration is turned off. Am I going to turn off acceleration on my Kindle Fire? No. I don’t want to miss out on the next wave of performance optimizations in Silk. The browser is sound. It holds its own compared to other tablet browsers. Once the acceleration gets sorted out I expect it’ll do even better.
More importantly, it’s nice to have some real data and to have Loadtimer to help with future comparisons. Doing these comparisons to see which browser/tablet/phone is fastest makes for entertaining reading and heated competition. But all of us should expect more scientific rigor in the reviews we read, and push authors and ourselves to build and use better tools for measuring performance. I hope Loadtimer is useful. Loadtimer plus pcapperf and the Mobile Perf bookmarklet are the start of a mobile performance toolkit. Between the three of them I’m able to do most of what I need for analyzing mobile performance. It’s still a little clunky, but just as it happened in the desktop world we’ll see better tools with increasingly powerful features across more platforms as the industry matures. It’s still early days.
Loadtimer: a mobile test harness
Measuring mobile performance is hard
When Amazon announced their Silk browser I got excited reading about the “split architecture”. I’m not big on ereaders but I pre-ordered my Kindle Fire that day. It arrived a week or two ago. I’ve been playing with it trying to find a scientific way to measure page load times for various websites. It’s not easy.
- Since it’s a new browser and runs on a tablet we don’t have plugins like Firebug.
- It doesn’t (yet) support the Navigation Timing spec, so even though I can inspect pages using Firebug Lite (via the Mobile Perf bookmarklet) and Weinre (I haven’t tried it but I assume it works), there’s no page load time value to extract.
- Connecting my Fire to a wifi hotspot on my laptop running tcpdump (the technique evangelized by pcapperf) doesn’t work in accelerated mode because Silk uses SPDY over SSL. This technique works when acceleration is turned off, but I want to see the performance optimizations.
While I was poking at this problem a bunch of Kindle Fire reviews came out. Most of them talked about the performance of Silk, but I was disappointed by the lack of scientific rigor in the testing. Instead of data there were subjective statements like “the iPad took about half as long [compared to Silk]” and “the Fire routinely got beat in rendering pages but often not by much”. Most of the articles did not include a description of the test procedures. I contacted one of the authors who confided that they used a stopwatch to measure page load times.
If we’re going to critique Silk and compare its performance to other browsers we need reproducible, unbiased techniques for testing performance. Using a stopwatch or loading pages side-by-side and doing a visual comparison to determine which is faster are not reliable methods for measuring performance. We need better tools.
Introducing Loadtimer
Anyone doing mobile web development knows that dev tools for mobile are lacking. Firebug came out in 2006. We’re getting close to having that kind of functionality in mobile browsers using remote debuggers, but it’s pretty safe to say the state of mobile dev tools is 3-5 years behind desktop tools. It might not be sexy, but there’s a lot to be gained from taking tools and techniques that worked on the desktop and moving them to mobile.
In that vein I’ve been working the last few days to build an iframe-based test harness similar to one I built back in 2003. I call it Loadtimer. (I was shocked to see this domain was available – that’s a first.) Here’s a screenshot:
The way it works is straightforward:
- It’s preloaded with a list of popular URLs. The list of URLs can be modified.
- The URLs are loaded one-at-a-time into the iframe lower in the page.
- The iframe’s onload time is measured and displayed on the right next to each URL.
- If you check “record load times” the page load time is beaconed to the specified URL. The beacon URL defaults to point to loadtimer.org, but you can modify it if, for example, you’re testing some private pages and want the results to go to your own server.
- You can’t test websites that have “framebusting” code that prevents them from being loaded in an iframe, such as Google, YouTube, Twitter, and NYTimes.
There are some subtle optimizations worth noting:
- You should clear the cache between each run (unless you explicitly want to test the primed cache experience). There’s no way for the test harness to clear the cache, but it does have a check that helps remind you to clear the cache. (It loads a script that is known to take 3 seconds to load – if it takes less than 3 seconds it means the cache wasn’t cleared.)
- It’s possible that URL 1’s unload time could make URL 2’s onload time be longer than it actually should be. To avoid this
about:blankis loaded between each URL. - The order of the preset URLs is randomized to mitigate biases across URLs, for example, where URL 1 loads resources used by URL 2.
Two biases that aren’t addressed by Loadtimer:
- DNS resolutions aren’t cleared. I don’t think there’s a way to do this on mobile devices short of power cycling. This could be a significant issue when comparing Silk with acceleration on and off. When acceleration is on there’s only one DNS lookup, whereas when acceleration is off there’s a DNS lookup for each hostname in the page (13 domains per page on average). Having the DNS resolutions cached gives an advantage to acceleration being off.
- Favicons aren’t loaded for websites in iframes. This probably has a negligible impact on page load times.
 Have at it
The nice thing about the Loadtimer test harness is that it’s web-based – nothing to install. This ensures it’ll work on all mobile phones and tablets that support JavaScript. The code is open source. There’s a forum for questions and discussions.
There’s also a results page. If you select the “record load times” checkbox you’ll be helping out by contributing to the crowdsourced data that’s being gathered. Getting back to what started all of this, I’ve also been using Loadtimer the last few days to compare the performance of Silk to other tablets. Those results are the topic of my next blog post – see you there.
