HTTP Archive: nine months
Although the HTTP Archive was announced in March, I actually started gathering data back in November of 2010. This week’s run marks nine months from that initial crawl. The trends show that performance indicators are mixed, with some critical metrics like size and redirects on the rise.
[As a reminder, the HTTP Archive currently crawls approximately 17,000 of the world’s top websites. All of the comparisons shown here are based on choosing the “intersection” of sites across all of those runs. There are ~13K sites in the intersection.]
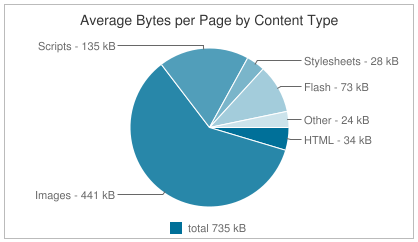
The transfer size of pages has increased 15% (95 kB) over nine months. The average size is now up to 735 kB. Note that this is the transfer size. Many text resources (including HTML documents, scripts, and stylesheets) are compressed so the actual size is larger. The bulk of this growth has been in images – up 18% (66 kB). Scripts have had the greatest percentage increase growing 23% (25 kB).
Note that these sizes are the total size of all images in the page and all scripts in the page, respectively. The average size of individual resources has stayed about the same over this nine month period. If individual resource size is the same, how is it that the total page size has increased? The increase in total transfer size is the result of a 10% increase in HTTP requests per page – that’s seven more resources per page.
Redirects are known to cause page delays, and yet the percentage of sites containing at least one redirect increased from 58% to 64%. Requests that fail are wasteful using connections that could have been used more productively, but sites with errors grew from 14% to 25%.
All the news isn’t gloomy. The use of Google Libraries API has increased from 10% to 14%. This is good for performance because it increases the likelihood that as a user navigates across sites the most common resources will be in their cache. In addition, serving those from the Google Libraries servers might be faster and more geographically distributed for smaller sites.
The use of Flash has dropped 2% from 47% to 45% of websites. Flash resources average 58 kB which is much larger than other resources, and there are fewer tools and best practices for optimizing Flash performance.
There are still many resources that do not have the necessary HTTP response headers to make them cacheable. Luckily the trend is moving toward more caching: the 61% of resources that did not have headers to make them cacheable has dropped to 58%. Stating the inverse, the number of resources with caching headers grew from 39% to 42% (+3%).
Here’s a recap of the performance indicators from Nov 15 2010 to Aug 15 2011 for the top ~13K websites:
- total transfer size grew from 640 kB to 735 kB
- requests per page increased from 69 to 76
- sites with redirects went up from 58% to 64%
- sites with errors is up from 14% to 25%
- the use of Google Libraries API increased from 10% to 14%
- Flash usage dropped from 47% to 45%
- resources that are cached grew from 39% to 42%
My kids started school this week. I’m hoping their first report card looks a lot better than this one.
(lack of) Caching for iPhone Home Screen Apps
Yesterday’s post, Unexpected Reloads in WebKit, revealed an interesting behavior that affects caching in Safari:
When you load the same URL back-to-back in Safari, the second load is treated the same as hitting Reload.
This is bad for performance because the browser issues a Conditional GET request for each resource instead of using the cached resource.
It’s important to be aware of this behavior when testing the primed cache experience in Safari, so web performance engineers should take note. However, in the real world it’s unlikely this behavior has much of an impact on desktop users. Here’s the table from yesterday’s post that shows how this Reload-like behavior is triggered when re-requesting a page:
| way of loading URL again | like Reload? |
|---|---|
| hit RETURN in location field | yes |
| delete URL and type it again | yes |
| launch same URL via bookmark | yes |
| click link to same URL | yes |
| go to another URL then type 1st URL again | no |
| modify querystring | no |
| enter URL in a new tab | no |
| Table 1. Triggering reload behavior in Safari | |
It’s possible that real world users might type the same URL or open the same bookmark two times in a row in the same tab, but it probably doesn’t happen that often. So what’s the big deal?
So what’s the big deal?
Whenever I see strange performance behavior I think about where that behavior might have a significant impact. Is there any place where this back-to-back Safari Reload behavior could have a significant impact? A comment from yesterday’s post hints at the answer:
Why is this article named “Unexpected Reloads in WebKit�
Chrome is based on Webkit and doesn’t has same issue. Perhaps it would be less confusing to name it “Unexpected Reloads in Safariâ€.
Other people gave me the same feedback on the backchannel – why did I say “WebKit” instead of “Safari”.
Here’s why: WebKit is used in a lot of browsers. Whenever I see a bug (or a feature) in one popular WebKit-based browser I wonder if it exists in others. The main WebKit-based browsers I focus on are Chrome, Safari, Android, and iPhone. As soon as I noticed this behavior in Safari my next step was to conduct the same tests in Chrome, Android, and iPhone. As the commenter noted, this unexpected Reload behavior does not happen in Chrome. And it does not happen on Android (tested on my Nexus S). But it does happen on iPhone.
While it’s true that iPhone users are unlikely to manually launch the same URL twice-in-a-row in the same tab, there is a situation when this happens automatically: when launching home screen apps.
Home screen apps are a powerful feature on iPhone and Android that allow users to save URLs to the home screen and launch them similar to native apps. Unfortunately, launching home screen apps on the iPhone triggers something similar to the Reload behavior we see in Safari – where resources aren’t read from cache and instead generate extra HTTP requests. Let’s take a look at a few examples of home screen apps, starting with simple to more complex.
Amazon: simple URL
Typing http://www.amazon.com/ into the iPhone browser displays a version of Amazon’s front page that is customized for mobile – there’s less content, the images are smaller, etc. However, there is not a prompt to save the URL to the home screen. We can do that anyway using the arrow function key at the bottom of the screen and selecting “Add to Home Screen”.
If you’ve used home screen apps you might have noticed that they always open in the same browser tab. Let’s run a little test to confirm this:
- Click the Amazon home screen icon. This opens Amazon in mobile Safari.
- Open another tab by clicking the “pages” function key and opening a “New Page”. Enter some non-Amazon URL in this new tab, for example http://fast.stevesouders.com/ (a very lightweight page I use for testing). At this point we have at least two tabs, one with Amazon and one with fast.stevesouders.com, and we’re looking at the fast.stevesouders.com tab.
- Go back to the home screen and click the Amazon icon again.
- Note that you’re taken back into mobile Safari to the first tab that contains Amazon.
We just opened the exact same URL back-to-back in the same tab. We didn’t do it intentionally – that’s the default behavior for iPhone home screen apps. Here’s a waterfall chart for this test. (You can view an interactive waterfall by loading the HAR file in pcapperf.)

The home screen app URL is http://www.amazon.com/gp/aw/h.html/187-9233150-9797455. The first time the home screen app is launched starts at the top with 187-9233150-9797455. Since the cache was empty all the subsequent resources have 200 responses. There are some 404s for icons followed by the request for fast.stevesouders.com.
The second launch of the Amazon home screen app (187-9233150-9797455 below fast.stevesouders.com) is where it gets interesting. When the Amazon home screen app is launched the second time, a Conditional GET request is made for all of the resources even though these resources are in the cache with a future expiration date.
All of the resources that are re-requested have an expiration date more than 10 years in the future. For example, the response headers for title_gradient._V233984477_.png are:
content-length: 291
expires: Tue, 06 May 2031 21:44:21 GMT
last-modified: Mon, 10 Aug 2009 11:50:45 GMT
cache-control: max-age=626560472
date: Wed, 29 Jun 2011 01:09:49 GMT
content-type: image/png
We know it was cached because when the Amazon home screen app is launched the second time the Conditional GET request for title_gradient._V233984477_.png has an If-Modified-Since header that contains the last-modified date in the initial response:
if-modified-since: Mon, 10 Aug 2009 11:50:45 GMT
It appears that we’ve stumbled into the Reload-like behavior we saw in Safari on the desktop. Further evidence of this is if you launch the home screen app, then type a new URL over the Amazon URL, and launch the home screen app again the resources are read from cache instead of generating numerous Conditional GET requests. (Load this HAR file in pcapperf to see for yourself.)
Untappd: full screen app
Amazon was a simple home screen app – really just a bookmark on the home screen. Developers can do more with home screen apps to make them launch and look like native apps. As described in Apple’s How-To’s for Safari on iPhone, various parts of the home screen app user experience are customizable including the home screen icon, viewport, and zooming and scaling. Developers can also have their home screen app launch in “full screen mode” by hiding the Safari UI components, including the status bar and location bar. In this situation, every time the home screen app is launched it uses the same “tab” with the exact same URL – thus triggering the Reload behavior.
Let’s have a look at Untappd on the iPhone. The first time you navigate to http://untappd.com/ in iPhone’s browser you get a suggestion to add the web app to the home screen:

After which you’ll have a customized Untappd home screen icon:
Now let’s investigate how caching works for this home screen app. We start by clearing the cache then launching the home screen app. You’ll notice there is no location bar or other Safari controls. Then we go back to the home screen and launch the Untappd home screen app again. The waterfall chart is shown below. (Here’s the HAR file.)

The first time the Untappd home screen app is launched it loads seven HTTP requests. Three of these resources are cacheable: jquery.min.js (1 year), gears_init.js (1 hour), and ga.js (1 day). Loader.gif and ajax-loader.png don’t have a future expiration date, but they do have Last-Modified and ETag response headers that could be used in a Conditional GET request.
But we see that the second time Untappd is launched from the home screen, all of the resources are re-requested. To make matters worse, none of these are Conditional GET requests, so a 200 status code is returned with the full response body.
The punchline
It’s unfortunate that home screen apps suffer from this bad caching behavior on the iPhone. Thankfully, there is a workaround: application cache. I ran similar tests on other home screen apps that use application cache. The resources listed in the CACHE: section of the manifest file were used on the iPhone without generating Conditional GET requests.
I feel bad about recommending the use of application cache. This is an issue with the browser cache on mobile Safari (and to a lesser degree on desktop Safari) that should be fixed. It’s a significant amount of work for developers to adopt application cache. The plus side is that doing so achieves the ability to work offline.
After this lengthy analysis and numerous waterfalls, here’s the punchline in a nutshell:
Home screen apps on iPhone are slower because resources are re-requested even though they should be read from cache. Use application cache to avoid this performance problem.
Unexpected Reloads in WebKit
People who work on web performance often need to load the same URL over and over again. Furthermore, they need to do this while simulating a real user’s empty cache experience and primed cache experience. When I want to analyze the empty cache experience the flow is simple: go to about:blank, clear the browser cache, enter the URL, and hit RETURN.
But what’s the right way to fetch a page repeatedly when analyzing the primed cache experience?
The main goal when testing the primed cache version of a page is to see which resources are read from cache. The goal for better performance is to cache as many responses as possible thus reducing the number of requests made when the cache is primed. If a resource has an expiration date in the future, the browser uses the cached version and doesn’t have to make an HTTP request resulting in a faster page. If a resource is expired (the expiration date is in the past) the browser issues a Conditional GET request using the If-Modified-Since and If-None-Match request headers. If the resource hasn’t changed then the server returns a simple 304 status code with no body. This is faster (because there’s no response body) but still takes time to do the HTTP request. (See my article on ETags for examples of IMS and INM.)
One way to re-request a page is to hit the Reload button, but this doesn’t give an accurate portrayal of the typical primed cache user experience. Hitting Reload causes the browser to always make an IMS/INM request for resources in the page, even for cached resources that have an expiration date in the future. Normally these resources would be used without generating an HTTP request. Although users do occasionally hit the Reload button it’s more likely that they’ll navigate to a page via a link or the location field, both of which avoid the time consuming Conditional GET requests generated when hitting Reload.
The technique I adopted years ago for re-requesting a page when testing the primed cache is to click in the location field and hit RETURN. That’s a fine approach in IE, Firefox, Chrome, and Opera, but not in Safari. Let’s investigate why.
hitting RETURN in the location field
I’m using Untappd as an example. Untappd has 68 requests when loaded on the desktop. Figure 1 shows the waterfall chart for the first 31 requests when loaded in Firefox 4 with an empty cache:

- Figure 1. untappd.com – Firefox 4 – empty cache
Most of the resources shown in Figure 1 have an expiration date in the future and therefore won’t generate an HTTP request if the user has a primed cache. To test that I click in the location field and hit RETURN. The resulting waterfall chart is shown in Figure 2. Sure enough the number of HTTP requests drops from 68 to 4!

- Figure 2. untappd.com – Firefox 4 – primed cache
If you repeat this experiment in Chrome, Firefox, Internet Explorer, and Opera you’ll get similar results – empty cache generates 68 requests, primed cache generates 4 requests. However, the result is very different in Safari 5. It’s important to understand why.
Safari is different
This test shows that Untappd has done a good job of optimizing the primed cache experience – the number of HTTP requests made by the browser drops from 68 to 4. Running the same test in Safari 5 produces different results. Clearing the cache and loading untappd.com in Safari 5 loads 68 HTTP requests – just as before. To test the primed cache experience we click in the location field and hit RETURN. Instead of only 4 requests there are 68 HTTP requests.
Why are there 64 more HTTP requests in Safari 5 for the primed cache test? Looking at the HTTP request headers we see that these are all Conditional GET requests. Let’s use http://ajax.googleapis.com/ajax/libs/jquery/1.4.2/jquery.min.js as the example (it’s the 8th request in Figure 1). In the empty cache scenario the HTTP request headers are:
Accept: */*
Cache-Control: max-age=0
Referer: http://untappd.com/
User-Agent: Mozilla/5.0 (Macintosh; [snip...] Safari/533.20.27
The HTTP status code returned for that empty cache request is 200 OK.
In the primed cache test when we hit RETURN in the location field we see that the request for jquery.min.js contains an extra header:
Accept: */*
Cache-Control: max-age=0
If-Modified-Since: Mon, 15 Feb 2010 23:30:12 GMT
Referer: http://untappd.com/
User-Agent: Mozilla/5.0 (Macintosh; [snip...] Safari/533.20.27
The header that’s added in the primed cache test is If-Modified-Since. This is a Conditional GET request. The HTTP status code that’s returned is 304 Not Modified. Even though all I did was hit RETURN in the location field, Safari treated that like hitting the Reload button.
unexpected “reload” in Webkit
Unlike other browsers, Safari 5 treats hitting RETURN in the location field the same as clicking the Reload button. When else does this happen? Assuming you’ve loaded a URL in Safari and are looking at that page, this table lists various ways to load that URL again. For each technique I show whether loading the URL this way generates extra Conditional GET requests similar to clicking Reload.
| way of loading URL again | like Reload? |
|---|---|
| hit RETURN in location field | yes |
| delete URL and type it again | yes |
| launch same URL via bookmark | yes |
| click link to same URL | yes |
| go to another URL then type 1st URL again | no |
| modify querystring | no |
| enter URL in a new tab | no |
| Table 1. Triggering reload behavior in Safari | |
This black box testing indicates that whenever the same URL is loaded back-to-back in the same tab, Safari 5 treats it as a Reload. I was describing this behavior to Jay Freeman (saurik) at Foo Camp. He pointed me to this code from WebCore:
else if (sameURL)
   // Example of this case are sites that reload the same URL with a different cookie
   // driving the generated content, or a master frame with links that drive a target
   // frame, where the user has clicked on the same link repeatedly.
   m_loadType = FrameLoadTypeSame;
Searching in that same file for FrameLoadTypeSame we find this code:
case FrameLoadTypeReload:
case FrameLoadTypeReloadFromOrigin:
case FrameLoadTypeSame:
case FrameLoadTypeReplace:
   history()->updateForReload();
   m_client->transitionToCommittedForNewPage();
   break;
This code doesn’t account for the behavior, but it does show that FrameLoadTypeSame and FrameLoadTypeReload are treated as similar cases in this context, and perhaps that’s why IMS/INM requests are generated.
One important takeaway from this is: don’t hit RETURN in the location field to test primed cache experience in Safari. Instead, go to a different URL and then type the test URL in the location field, or open a new tab and type the URL.
There’s a second more important takeaway from this. I’ll cover that in tomorrow’s post. If you know the answer, please don’t spoil it. Oh what the heck – if you think you know the answer go ahead and add a comment.
HTTP Archive: 1M URLs, Internet Archive, Sponsors
The HTTP Archive provides a permanent record of web performance information. It started in October 2010 crawling 1K URLs. This was possible thanks to Pat Meenan’s help providing access to WebPagetest. A month later we increased coverage to the world’s top ~18K URLs. That was good, but the next step is 1M URLs. Today at Velocity I made two announcements that pave the way for achieving this goal.
Starting today the HTTP Archive is part of the Internet Archive. I met Brewster Kahle several years ago and have always admired the work the Internet Archive has done building a “digital library of Internet sites.” When I approached him about this merger we both saw it as an obvious fit. In addition to preserving a record of the content of these sites (via the Wayback Machine) we agreed it’s important to record how that content is built and served. It makes sense that researchers, historians, and scholars be able to find both sets of information under one roof. I’ll continue to run the HTTP Archive project.
The following companies have agreed to sponsor the work of the HTTP Archive: Google, Mozilla, New Relic, O’Reilly Media, Etsy, Strangeloop, and dynaTrace Software. In order to grow to 1M URLs we need data center space, servers, licenses, etc. Thanks to these sponsors we’ve started to build out this infrastructure and will be increasing our coverage soon.
I look forward to working with the Internet Archive on our mission of preserving a record of the Web for generations to come. If you would like to join the effort, I invite you to make a donation to the Internet Archive and contribute your coding skills to the open source project.
HTTP Archive: today’s runs
I just finished processing the “May 16 2011” run for HTTP Archive and HTTP Archive Mobile. Here are some interesting observations.
HTTP Archive (desktop)
As of today there is six months of historical data in the HTTP Archive. As a reminder, the world’s top ~17K web pages are being crawled. Since the actual URLs in the list at any given time can change, I start by looking at the trends for the intersection of URLs. This means the list of URLs is exactly the same for each data point. The total transfer size continues to grow: up 8 kB (1.1%) since the last run on Apr 30 2011, and up 53 kB (8%) from the first run back on Nov 16 2010.
Looking at the Image Transfer Size chart we see images are the main cause for this growth – up 5 kB from Apr 30 2011 and 43 kB since Nov 16 2010. Conversely, the transfer size of Flash has steadily dropped from 81 kB on Nov 16 2010 down to 71 kB on this last run on May 16 2011 – a 12% decrease.
I used the new Compare Stats page to compare the interesting stats from Nov 15 2010 to May 16 2011. I again chose the “intersection” of URLs to get an apples-to-apples comparison. In addition to the transfer size increases mentioned previously, we can see the growth of various JavaScript libraries on these ~17K web pages over the last six months:
- jQuery is up from 39% to 44%
- Facebook widgets have grown from 8% to 13%
- Twitter widgets increased from 2% to 4%
The “Pages Using Google Libraries API” chart shows adoption of this CDN has grown from 10% to 13% since Nov 16 2010. This means even more cross-site caching benefits for users.
HTTP Archive Mobile
The HTTP Archive Mobile just launched last week. There’s only two weeks of historical data gathered on just the top 100 web pages, so there aren’t any major shifts in the trending charts just yet. Nevertheless, comparing the mobile stats between the last two runs, May 12 and May 16, has some interesting revelations.
The “Pages with the Most JavaScript” chart shows that the Twitpic page’s JavaScript grew from 308 kB to 374 kB – a 66 kB (21%) increase. This highlights the value of HTTP Archive (both desktop and mobile) to individual websites as a way to track performance stats and have a permanent history.
There are some other interesting stats at the individual website level, but we’ll need a few months of mobile data before we can draw conclusions about any trends. In the meantime, check back here around the 15th and 30th of each month to see the latest runs and discover new observations about how the web is running.
HTTP Archive Mobile
This morning during my talk at Mobilism I announced the HTTP Archive Mobile – a permanent repository for mobile performance data.
Ever since I announced the HTTP Archive (based on data gathered from Internet Explorer using WebPagetest) people have been asking, “What about data gathered from a mobile device?” It’s a logical next step. Thankfully, Blaze.io came on the scene a few months ago with a solution, Mobitest, for connecting to mobile devices and gathering this kind of information. Blaze.io has been doing great work in the area of mobile performance. I met Guy Podjarny, Blaze.io’s CTO, a few months ago and we’ve had several discussions about performance. A few weeks ago Guypo and I decided to start working on the HTTP Archive Mobile. It required a few changes on his side and a few on mine, but we quickly got it up and running and have been gathering data for the past week in anticipation of this announcement.
Here are some interesting comparisons of the Top 100 web pages from desktop vs mobile:
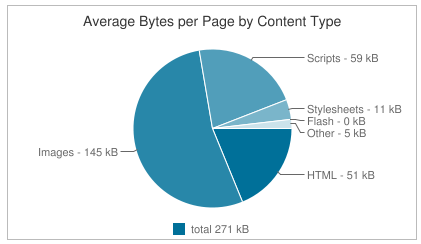
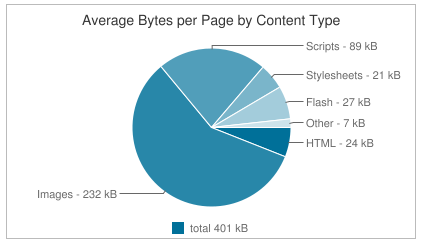
- Total bytes downloaded is 401 kB for desktop vs 271 kB for mobile.
- Total size of images, scripts, and stylesheets is smaller on mobile, but size of HTML is bigger. This is likely from JavaScript, CSS, and images being inlined in the HTML document – a good sign for performance.
- The New York Times is in the top 5 pages with the most JavaScript with 230 kB on desktop and 326 kB on mobile – 94 kB more JavaScript on mobile than desktop.
- The percentage of sites that have at least one redirect is 54% for desktop compared to 68% for mobile. Many websites (Facebook, Yahoo!, Bing, Taobao, etc.) redirect from www.* to m.* on mobile browsers. But it would be better to lower the mobile percentage since redirects inflict an even greater delay on mobile devices.
This is just the beginning. The HTTP Archive Mobile is currently in “Alpha” mainly because we’re gathering data for just the Alexa Global Top 100 sites and only have a week’s worth of data. More URLs and more data are on the way. Already there are valuable takeaways from what’s there, and these will increase as the number of websites and length of time grow. Take a look for yourself and add comments below on anything you find that’s interesting or puzzling. And thanks again to Guypo and Blaze.io for making the Mobitest framework available for collecting the data.
HTTP Archive: Top 100, Top 1000 & compare stats
Right now the HTTP Archive analyzes the world’s top 17,000 web pages gathering information about the site’s construction. It’s interesting data, especially for a performance junkie like me. Subsetting the data for comparisons is a challenge given the numerous ways this long list of URLs could be sliced.
This past week I added two new subsets: Top 100 and Top 1000. So now when you go to the Trends and Stats pages you have the following choices:
- All – The entire set of ~17K web pages but the exact URLs might vary from run to run due to errors, etc.
- intersection – The set of URLs for which data was gathered in every run. Right now there are ~15K that have data in every run so far. This is great for apples-to-apples comparisons.
- Top 100 – The world’s Top 100 based on Alexa.
- Top 1000 – The world’s Top 1000 based on Alexa.
There are some amazing differences between these sets of sites. To make it easier to explore these differences I added the Compare Stats page. You can pick two different runs and sets of URLs and see their stats charts side-by-side. I’m amazed at some of the differences between the Top 100 and Top 1000 for stats from the April 30 2011 run:
- total bytes downloaded: 401 kB vs 674 kB (Top 100 vs Top 1000)
- use of jQuery: 27% vs 43%
- use of Google Analytics: 25% vs 52%
- pages using Flash: 35% vs 49%
- resources with no caching headers: 26% vs 41%
Top 100 Bytes Downloaded

Top 1000 Bytes Downloaded
One takeaway is that stats that are critical for good performance (bytes downloaded, caching) worsen when we expand from the Top 100 to the Top 1000. What happens if we look further down the tail at “All”? I encourage you to check it out yourself and see how your site compares.
HTTP Archive: servers and most 404s
I launched the HTTP Archive about a month ago. The reaction has been positive including supportive tweets from Tim O’Reilly, Werner Vogels, Robert Scoble, and John Resig. I’m also excited about the number of people that have already started contributing to the project. Two new stats charts are available thanks to patches from open source contributors.
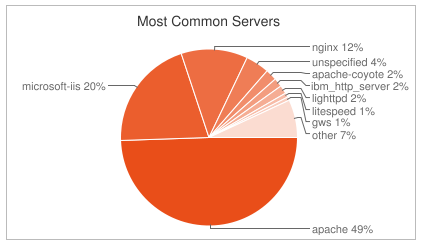
James Byers contributed the patch for generating the Most Common Servers pie chart. This chart is similar to BuiltWith’s Web Server chart. BuiltWith shows a higher presence of IIS than shown here. Keep in mind the sample sets are different – the HTTP Archive hits the world’s top ~17K URLs while BuiltWith is covering 1M URLs.
The other new chart comes from Carson McDonald. It shows pages with the most 404s. Definitely a list you don’t want to find your website on.
l’ve added some other features I’ll blog about tomorrow and am planning a bigger announcement later this week, so stay tuned for some more HTTP Archive updates.
HTTP Archive: max-age
There’s a long list of interesting stats to be added to the HTTP Archive. I’m planning on knocking those off at about one a week. (If someone wants to help that’d be great – contact me. Familiarity with MySQL and Google Charts API is a plus.)
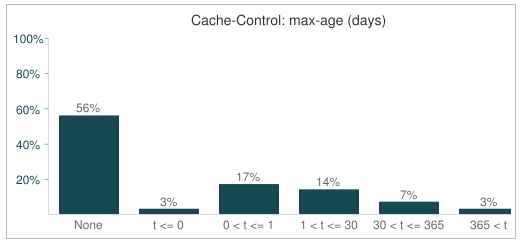
Last week I added an interesting stat looking at the cache lifetime being specified for resources – specifically the value set in the Cache-Control: max-age response header. As a reminder, the HTTP Archive is currently analyzing the top ~17K websites worldwide. Across those websites a total of ~1.4M resources are requested. The chart below shows the distribution of max-age values across all those resources.
56% of the resources don’t have a max-age value and 3% have a zero or negative value. That means only 41% of resources are cacheable. In more concrete terms, the average number of resources downloaded per page is 81. 33 of those are cacheable, but the other 48 will likely generate an HTTP request on every page view. Ouch! That’s going to slow things down. Only 24% of resources are cacheable for more than a day. Adding caching headers is an obvious performance win that needs wider adoption.
HTTP Archive: URL list, Flash trends
Last week I announced the launch of the HTTP Archive. The feedback has been very positive. I’ve already heard from a handful of performance gurus who have downloaded the data and done additional analyses. This was a major goal of the project and I’m excited to see it happening.
I made a few changes to HTTP Archive that I wanted to share in this blog post.
First, there’s a potential for apples-to-oranges comparisons because the list of URLs “crawled” by HTTP Archive changes from run to run due to errors and changes in the “top N” sorting of sources like Alexa and Fortune 500. When comparing two runs it’s unclear if differences are caused from a change in the sample set or actual changes in Internet behavior. This was exemplified by this tweet from @orionlogic:
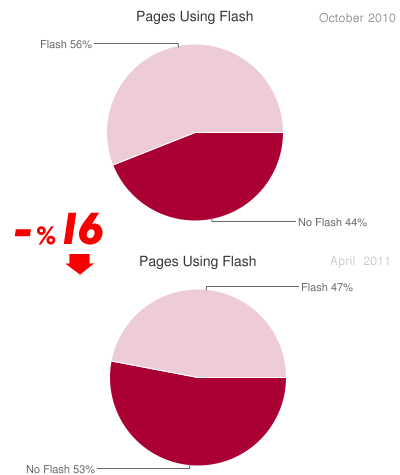
Website flash usage dropped %16 since 6 months http://t.co/XI7IWvc (via httparchive.org + @souders ) #noflash
The link contains two pie charts from HTTP Archive:
The issue is that the number of URLs grew from ~1000 in October 2010 to ~17,000 in April 2011. Those additional 16,000 websites have different behavior when it comes to using Flash. If we compare Nov 15 2010 to Mar 29 2011, both of which use ~17,000 URLs, the change is only 2%.
I made some changes to mitigate this issue.
- The first three runs that were done with only 1000 URLs are now hidden in the UI. The data is still available.
- Similar confusion can happen when viewing trending charts. The fix there is to use the “intersection” set of URLs across all runs. I added a note next to the “choose URLs” pick list to point out the benefit of choosing “intersection”. I moved the plot of “URLs Analyzed” to the top so it’s more apparent when the number of URLs changes from run to run.
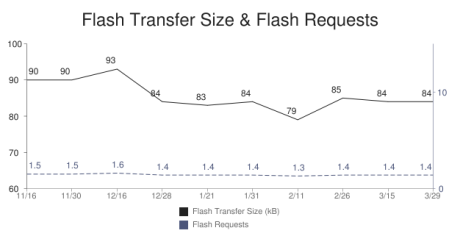
On another note, Nicole Sullivan suggested I add a trending chart for transfer size and number of requests for Flash, in addition to the existing charts for HTML, JavaScript, CSS, and Images. The hypothesis was this might explain the increase in image sizes that I presented in my previous post – perhaps Flash was on the decline being replaced by HD images. The chart shows a slight decline in the size and number of Flash files, but not enough to explain the 61 kB increase in image transfer size.
I made several other fixes that are less visible. Several people have submitted requests for new stats. I’ll keep knocking those off and blogging about them.

