Mobile waterfalls
I often scan the mobile dev tools landscape and get flashbacks to 2005 when debugging and profiling in desktop browsers was nigh impossible. This was before Firebug when alert was the primary means of debugging.
woe is mobile dev tools
Most of the tools that exist for desktop web development are also needed on mobile. That’s obvious. And yet, despite more than six years of mobile web development many necessary tools are still missing. Browser vendors and tool hackers should just walk through the most useful desktop dev tools and make sure they’re available on mobile.
But it’s complicated. Extensions for mobile browsers are hindered by, well, the absence of an extensions API. While Firefox for Android and Opera Mobile support extensions, Chrome for Android and Mobile Safari do not. The lack of an extensions API for these popular browsers is a setback. It can be worked around by writing mobile apps that use OS hooks to capture the information needed by web developers, but those types of apps are likely to run afoul of app store approval processes, and in some cases the OS hooks aren’t available.
I chose to create the Mobile Perf bookmarklet as a way to get dev tools on all mobile devices. The Mobile Perf bookmarklet is an uber-bookmarklet that includes these other tools: Firebug Lite, Page Resources, Docsource, DOM Monster, Storager, YSlow, SpriteMe, and CSSess. These tools are great, but they’re just JavaScript running in the page and don’t have access to the browser’s internals. For example, Firebug Lite includes a console and DOM walker, but doesn’t support JavaScript debugging and profiling.
Mobile browser vendors have provided remote debuggers in the last year or two. These include Chrome for Android, Opera Dragonfly, Firefox for Android, and iOS Safari. These remote debuggers have more detailed information and more powerful features, but they all require a separate laptop and the setup is a bit complex.
my kingdom for a (mobile) waterfall chart
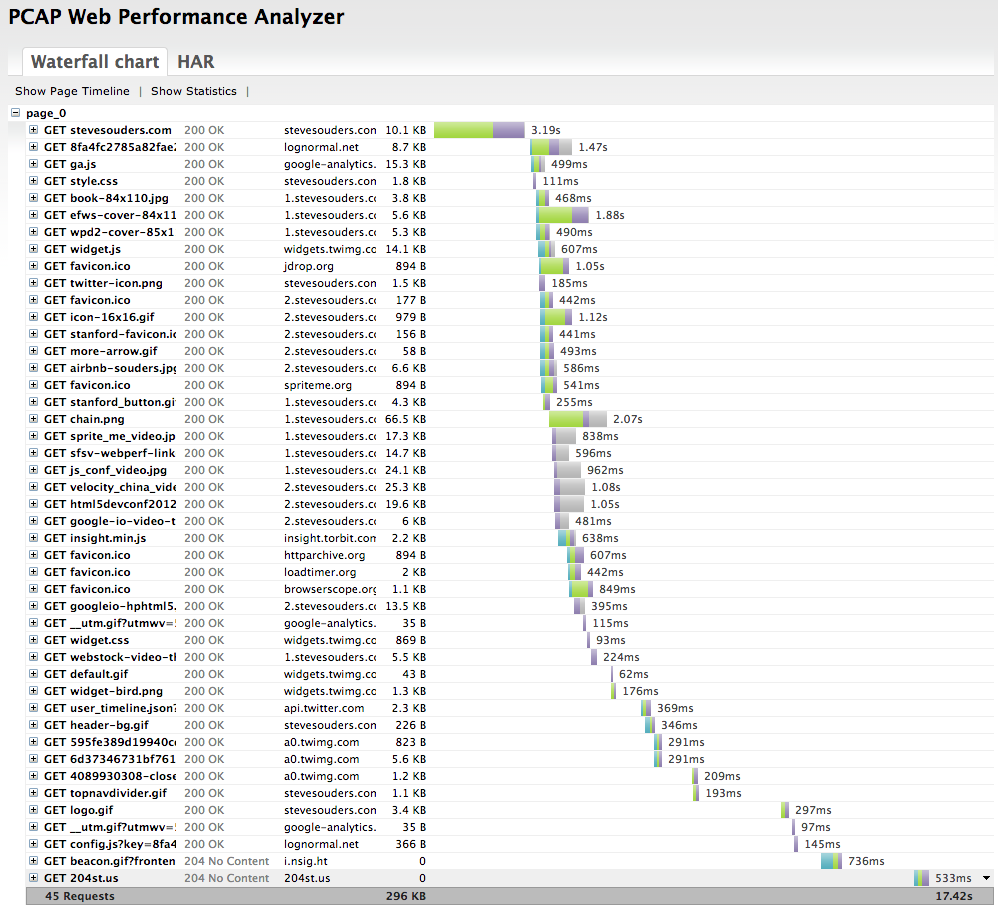
As a performance engineer my primary analysis tool is a waterfall chart. All major desktop browsers have embedded dev tools for generating waterfall charts. There are also out-of-browser tools, such as HttpWatch. Here’s an example waterfall chart from Chrome 25 for my website:

It took me about 3 minutes to generate this waterfall chart – and that includes the time to capture the screenshot and upload it to my server. While it’s easy to generate waterfall charts on the desktop, it’s much more time consuming to do this for mobile devices. The main solution for getting mobile waterfall charts is to use a remote debugger, but this is complicated:
- I don’t have every remote debugger installed on my laptop.
- Even if I have the appropriate remote debugger, they take time to setup and connect for each mobile device.
- There might not be a remote debugger for my particular mobile device.
my solution
The solution I would prefer is to have mobile browsers generate waterfall charts natively with the option to export them to a remote server for later analysis on a larger screen. (If you work on a mobile browser please add this!) Until this becomes a standard feature, I generate mobile waterfall charts by running tcpdump on my laptop and connecting my mobile device to it via a wifi hotspot.
This solution is as complex as setting up a remote debugger. In fact, it’s probably more complex. But it works for all mobile devices. Once I get it set up I can walk through all my various mobile devices to gather waterfall charts.
In the remainder of this blog post I’ll go over the specific step-by-step instructions for gathering mobile waterfall charts using this approach. The initial steps are heavily based on the pcaphar CaptureMobileTraffics page, but I go further to explain how to do this without a LAN connection going through a portable hotspot. These instructions are based on using my MacBook Air running 10.8.3.
1: wifi hotspot
I start by creating a wifi hotspot on my MacBook Air. This step assumes you’re connected to the Internet using an Ethernet connection. On my MacBook Air this is done using an Apple USB Ethernet Adaptor (aka, “dongle”).
- Open a shell terminal and run
ifconfig -a. Save the output – we’ll refer to it later. - Click on the Apple icon -> System Preferences…
- Click on “Sharing” in the Internet & Wireless section.
- Make sure the “Internet Sharing” service is highlighted on the left, but don’t select the checkbox just yet. (If the controls are disabled remember to click on the lock to enter the admin password.)
- For “Share your connection from:” select “USB Ethernet”. (This is where my laptop is getting its connection to the Internet.)
- For “To computers using:” select “Wi-Fi”. (This is where my laptop is sharing it’s Internet connection with others.)
- Click “Wi-Fi Options…”.
- For “Network Name:” I’ll enter “ss-laptop”.
- Leave “Security:” at “WPA2 Personal”.
- Enter an 8 character password.
- Click OK to save these Wi-Fi options.
- Select the checkbox next to “Internet Sharing” and choose “Start” when prompted.
The wifi hotspot should be active at this point. Connect your mobile device to the wifi hotspot you specified in step #6a, in my case “ss-laptop”. Navigate to some web pages on your mobile device to make sure it has an Internet connection.
To be certain my mobile device doesn’t fallback to the carrier network I often disable mobile data. On the iPhone (iOS 6) this is under Settings -> General -> Cellular. On my Samsung Galaxy Nexus (Android 4) this is under Settings -> Wireless & Networks More… -> Mobile networks.
You can confirm that your mobile device is using the laptop’s Internet connection by loading my HTTP Stuff page on both and making sure they have the same value for REMOTE_ADDR.
2: tcpdump
In this step we’ll capture some traffic from the mobile device.
I use tcpdump to capture the mobile device’s network requests. There are other tools you can use including Wireshark (formerly Ethereal). The tcpdump command is:
sudo tcpdump -i <iface> -n -s 0 -w <outfile> tcp or port 53
This generates a packet capture (pcap) file. You can specify any filename you want as the output file. I typically include the website I’m testing, the device I’m using, and the .pcap file extension, for example, “amazon-nexus.pcap”. Getting the correct interface is trickier. Run ifconfig -a again. For me the interface always starts with “en”, for example, “en1”. Look for an “en” interface that changed from “wifi hotspot” step 0 and now. For me it’s “en0”. I’m going to analyze https://stevesouders.com/ from my iPhone so I run this command in a shell:
sudo tcpdump -i en0 -n -s 0 -w souders-iphone.pcap tcp or port 53
Now I go to my iPhone (already connected to the “ss-laptop” wifi hotspot) and navigate to the page I want to analyze: https://stevesouders.com/. (If you’ve previously visited the page-to-be-analyzed then you might want to first clear your cache.) When it’s done loading I hit control-C to stop tcpdump. The souders-iphone.pcap file should be 300K+.
Protip: I create a BASH function to wrap the tcpdump command:
tcptrace ()
{
    if [ "" = "$1" ]; then
        declare outfile="aaa.pcap";
        echo "Using 'aaa.pcap' as the output file.";
    else
        declare outfile="$1";
    fi;
    if [ "" = "$2" ]; then
        declare iface="en1";
        echo "Using 'en1' as the interface.";
    else
        declare iface="$2";
    fi;
    sudo tcpdump -i $iface -n -s 0 -w $outfile tcp or port 53
}
With this function starting tcpdump is much simpler: tcptrace souders-iphone.pcap en0.
3: pcapperf
I use pcapperf to convert the pcap file to a HAR file and view it as a waterfall chart. pcapperf is an open source project from Bryan McQuade and Libo Song, both from Google. It’s very straightforward – simply upload the pcap file and you’ll see the waterfall chart.
Behind the curtains pcapperf uses the pcap2har project to convert the pcap file to a HAR file. HAR is a file format created by Jan Odvarko, Simon Perkins, and myself in 2009. It has become the industry standard for capturing web page loading information. It’s supported by Firebug, HttpWarch, IE 9+, Chrome, ShowSlow, WebPagetest, Fiddler, dynaTrace, Charles, and 20+ more. Jan (Honza) wrote the initial specification, and now there’s a draft W3C HAR spec. So once you have a HAR file you can use that in many other tools. For example, my HAR to PageSpeed tool generates a PageSpeed report from a HAR file enabling us to get a full PageSpeed analysis on our mobile pages.
4: USB wireless adapter
The steps so far work for most mobile developers who want to see waterfall charts – most people have a laptop that can run a wifi hotspot while connected to the Internet over Ethernet. For me, however, this wasn’t enough. I often don’t have an Ethernet connection. In fact, my laptop uses wifi 90%+ of the time. I especially want to capture mobile waterfalls during presentations where there often isn’t a LAN connection. But my MacBook Air, like most laptops, only has one wireless card. So I can’t be connected to wifi AND run a wifi hotspot. I used to get around this by carrying around a wireless router in my laptop bag – isn’t that convenient! You can see how I literally danced getting that to work during a tech talk at LinkedIn.
Now I have a better solution: I use a USB wireless adapter. It was hard to find one that worked on Mac OS. I settled on the netis WF-2111 150Mbps for ~$10. It comes with a Windows CD with the drivers, so I just downloaded them from the product page. When I plug the netis wireless adapter into my USB port the associated Wireless Network Utility starts up. I simply choose my normal wifi network from the Available Networks. Now I can remove my Ethernet cord and everything still works.
5: portable mobile hotspot
At this point we can generate mobile waterfall charts from any device even in the absence of an Ethernet connection. The main downside is it’s using a wifi connection – not a mobile carrier network. We can get a step closer to a true mobile experience by connecting the laptop to a portable hotspot running on a second mobile device. I do this on my Galaxy Nexus by going to Settings -> Wireless & Networks More… -> Tethering & portable hotspot -> Set up Wi-Fi hotspot. I use “ss-nexus” as the Network SSID, create a password, and Save. Clicking Portable Wi-Fi hotspot turns it on.
Returning to the Wireless Network Utility on my laptop I connect the netis USB wireless adapter to “ss-nexus”. I might have to re-connect the first mobile device (my iPhone in this case) to “ss-laptop” since it might have dropped that connection when the laptop switched to “ss-nexus”. The setup at this point is:
- The mobile device I’m testing (my iPhone) is connected to “ss-laptop” – the wifi hotspot running on my MacBook Air.
- My MacBook Air is using the netis USB wireless adapter to connect to “ss-nexus” – the portable hotspot on my Galaxy Nexus.
- My Galaxy Nexus is connected to the Internet via its mobile carrier network (T-Mobile).
With this setup I can capture a waterfall chart from any mobile device with all the traffic going over a mobile carrier network. Here’s the waterfall for https://stevesouders.com/ on my iPhone going over T-Mobile:
This is a lot of steps and is likely more complex than using a remote debugger. But I like that it’s one setup that works for all mobile devices, even devices that don’t have a remote debugger. What I’d really like is to have a waterfall chart capturing feature built into mobile browsers directly. This could be viewable on the mobile device, but could very easily be a HAR file that could be uploaded, viewed, and analyzed in the many tools that support HAR. Until then, I’ll just keep my tiny USB wireless adapter handy – that’s a lot easier than carrying a wireless router everywhere I go.
_ck_ | 26-Mar-13 at 9:11 pm | Permalink |
Very clever. But I noticed on Android 4.x (ICS & JellyBean) all the browsers (native, Firefox and Chrome) have some kind of plugin support? So maybe with a bit of research, events could be at least captured and written to a HAR?
Another tricky approach might be to use the device as a modem in tether mode over USB or wifi and run an emulator on the PC through that connection, then sniff that connection.
Other than a mobile browser plugin though, you’ll never be able to capture https and SPDY events.
Andy Davies | 27-Mar-13 at 2:42 am | Permalink |
You might want to take a look at MIHTool http://www.iunbug.com/mihtool for iOS
It uses UIWebView rather than Safari but does have a HAR generator / viewer.
Not had a chance to play with it myself yet but it looks pretty interesting.
Steve Souders | 27-Mar-13 at 11:12 am | Permalink |
_ck_: Chrome for Android doesn’t support extensions. If you think otherwise, please provide a link. It’s best not to use emulators for performance analysis – they behave differently than the actual device.
Andy: MIHTool has some nice features for iPad, but the best features (including HAR files) aren’t supported on iPhone.
anonymouse | 27-Mar-13 at 4:33 pm | Permalink |
hmm.. you didn’t mention mobitest agent anywhere. did you have problems with it?
Steve Souders | 27-Mar-13 at 5:17 pm | Permalink |
anonymouse: Mobitest and WebPagetest are great, but they are limited in the following ways: They can only test public URLs (so anything in stealth mode or behind a firewall doesn’t work). They don’t have a limited set of phones and mobile browsers. I can’t use them from my geo location. They use wifi so I can’t see a mobile carrier network. Eventually they might have some devices using mobile carriers, but it might not be my mobile carrier. I can’t touch them – scroll, swipe, rotate, etc. Again – they’re great and I use them often – but mobile developers need and deserve the same set of tools we had for desktop.
Manish Lachwani | 27-Mar-13 at 6:58 pm | Permalink |
Hi Steve,
Agree that mobile developers need and deserve the same set of tools we have for the desktop – Appurify has been built to solve these problems.
We have hosted and on-premise devices that cover all iOS and Android versions. You can set GEO Location on real devices on the fly. Devices are both on wifi and carriers. Runtime instrumentation of network profiles, carrier profiles etc. Support for all multi touch gestures like pinch, swipe, drag, flick, scroll etc. Support for all orientations.
All capabilities available via a simple REST API. Plus we have runtime native and html5 inspectors for apps on real devices. Additionally, we provide load time characteristics for both apps and browsers (Chrome, Axis, Safari, Opera, Mercury). All this is automated.
Let me know if you have any questions.
thanks,
JP | 28-Mar-13 at 12:22 am | Permalink |
If Apple were to add the resource timing API to iOS, it would be a step in the right direction. Andy Davies demonstrated a very cool waterfall bookmarklet in the performance calendar last December:
http://calendar.perfplanet.com/2012/an-introduction-to-the-resource-timing-api/
(actually other mobile browsers could benefit from the API; I don’t know the current support for resource timing)
Steve Souders | 28-Mar-13 at 12:30 am | Permalink |
JP: Resource timing is the 2nd of 3 “Web Timing” specs. The 1st was Navigation Timing. Sadly, Navigation Timing isn’t even supported by mobile Safari, let alone Resource Timing. In fact, neither of them is even supported in desktop Safari. Very disappointing.
Paul Irish | 28-Mar-13 at 12:59 am | Permalink |
I wanted to show what grabbing a HAR file from Chrome on Android looks like, so I made a short video:
http://youtu.be/U3egfEwI-Vc 2:47 long
I use remote debugging, show off HAR file extraction and then demo a few more quick features.
One feature I didn’t show off was the newly added “Copy as Curl” command in the Network panel item context menu. Here’s a screenshot: https://twitter.com/ChromiumDev/status/317183238026186752
Steve Souders | 28-Mar-13 at 9:54 am | Permalink |
Paul: That is a super video demo’ing Chrome for Android remote debugging and waterfalls. Here’s another video that shows how to startup remote debugging on your Android device (plus you’ll need the USB cable). I’d love to be able to capture the waterfall HAR file on my Android when I’m not tethered to my laptop, and view it later.
Steve Souders | 28-Mar-13 at 10:03 am | Permalink |
Paul: Also – it’s great that my Android device can still use my mobile network while remote debugging. These articles indicate that Opera Dragonfly and Firefox for Android have to be on a wifi network to enable remote debugging – which prevents you from seeing the performance over the mobile network.
Jiazheng | 06-Apr-13 at 11:53 pm | Permalink |
I want to see waterfalls of 3G/2G network. Are there any solutions?
Steve Souders | 07-Apr-13 at 12:10 am | Permalink |
Jiazheng: Yes – there are several alternatives.
1. The section “5: portable mobile hotspot” explains how to tether your laptop to a carrier network.
2. You can use the Chrome for Android remote debugger while your phone is still on a carrier network. See Paul’s video in comment #10. I believe this also works with the iOS Safari remote debugger, but not with Opera Dragonfly and Firefox for Android.
3. I just found out about Appurify. They’re kind of like DeviceAnywhere except they have more debugging and profiling including waterfall charts while the devices are on carrier networks.
Shmuel Krakower | 07-Apr-13 at 5:10 am | Permalink |
Very interesting, especially the diff between how your website loads from a mobile device in compare to loading it from your laptop / WIFI connection:
1. On mobile device/network it took 3 seconds to get the initial HTML page in compare to 1 second on the first screenshot you took from your laptop.
1.1. Was the second screenshot was taken from a mobile network (as described in section 5) or from your WiFi connection? I would assume 3 seconds are due to the mobile operator network? If not, it means that this kind of setup (Mobile Device -> Hot spot -> WiFi) adds meaningful overhead?
1.2. Had you the chance to compare the resulted HARs from your setup and with a remote debugging setup? Just interesting..
2. No offense, but is your homepage HTML normally loads in ~1 second from a laptop? that’s fast for sure, but could have been faster. I would expect your site to be the ultimate best-practices-followed and render faster :) I got my baby site to load at around 200ms (without too much of an effort, just following few best practices). I am not referring to my blog but to this: http://www.beatsoo.org
Steve Souders | 07-Apr-13 at 9:17 am | Permalink |
Shmuel: Thanks for your comment. In response:
1.1 As it says, the second screenshot was “on my iPhone going over T-Mobile” – so that was from a mobile network.
1.2 I did not compare the waterfalls from tcpdump to those from a remote debugger, but I think that would be VERY interesting. If you do that please comment back here.
2. Cobbler’s children have no shoes. I’m hobbled by WordPress and my shared server, and would rather work on general techniques for the community.
Shmuel Krakower | 09-Apr-13 at 1:10 am | Permalink |
Thanks for replying!
Regarding 1.2 – as for now, I don’t play with mobile performance, so I won’t compare the diff.
If someone else is doing so, please comment your results here.
Patrick D'Souza | 09-Apr-13 at 6:14 am | Permalink |
You could do the same using Fiddler and proxying all mobile requests via your desktop and fiddler. I had given a presentation a couple of months ago on generating mobile waterfalls using Fiddler – http://www.nywebtech.com/events/84118922/. This solution works very well for testing beta sites setup in your desktop’s hosts file and it works on Windows.