Creating a Performance Culture
[Originally posted in the 2012 Performance Calendar. Reposting here for folks who missed it.]
The performance community is growing. With 17K members across 46 meetup groups it’s pretty easy to find someone else who cares about performance. But what if your company is new to the world of high performance websites? How can you make performance a priority within your organization? I don’t have a guaranteed recipe, but here are some key ingredients for creating a culture of performance where you work.
- Get Support from the Top
- If you’re lucky like me, your CEO is already on the web performance bus. It might even have been their idea to focus on performance, and you’ve been recruited to lead the charge. If this isn’t your situation, you have to start your evangelism at the top. You might start with the CEO, or perhaps COO or an SVP. The key is it has to be someone who is a leader across the different organizations within your company. The culture shift to focus on performance doesn’t happen in engineering alone. It has to happen across product management, marketing, sales, and all other parts of the company. You need to identify who the key leader or leadership team is and get them excited about web performance, and make them believe in the benefits it delivers.
- Speak the Right Vocabulary
- As an engineer you probably know how to sell to other engineers. “Optimization†makes a developer’s ears perk up. Speaking in terms of reduced regressions and fewer outages wins over folks in devops. But you also need to know how to speak across the organization both horizontally and vertically. The UX team likes hearing about better user metrics (longer sessions, more sessions per month). The folks in finance wants to hear about reduced operating costs in terms of hardware, power consumption, and data center bandwidth. Marketing and sales will light up hearing case studies about doubling unique users from search engine marketing as a result of a faster website. Make sure to use terms that resonate with your audience.
- A key skill in evangelizing to upper management is knowing how to speak hierarchically – start with the high-level stats and drill down into the details if the need arises. I see many engineers who start with the details which many folks don’t have the time or background to follow. Start by showing a median and save the logarithmic scale charts in the “more slides†section.
- Pick the Right Product
- If you’ve convinced the senior execs to focus on performance, your next step is to pick a product to focus on. You want to pick a high visibility product, so that the wins are significant. But you don’t want to pick the company’s flagship product. It’s possible you might hit a few bumps on your first forays into adopting web performance. Also, you might have to alter the release cycle as you rollout metrics and start A/B testing. That’s harder to do with a product that’s the company’s cash cow. Start with a product that’s in the top 5 or 10, but not #1.
- Pick the Right Team
- The team you choose to work with is even more important than which product you choose. It all comes down to people, and if the team is too busy, has other priorities, or simply doesn’t believe in WPO (Web Performance Optimization) then you should move on to another team. You can always come back and revisit this team in the future.
- I always have a kickoff meeting with a team that’s interested in working on performance, and I ask how many people they can dedicate to work on performance. I’m usually looking for at least two people full-time for 3 months. Sometimes teams think it’s sufficient to have someone spend 20% of their time working on performance, but this usually doesn’t have a positive outcome. If this is the company’s first engagement with web performance, you want to make sure to pick a team that has the mindset and resources to focus on the work ahead.
- Pick the Right Task
- It’s critical that the first performance optimization deployed has a significant impact. There’s nothing more frustrating than getting folks excited about WPO only to have their work show no improvement. For most websites it’s fairly straightforward to pick an optimization that will have a big impact. I’m reminded of Ismail Elshareef‘s case study about Edmunds.com getting 80% faster. He talks about how the first task they picked was making resources cacheable. After just a day of work they pushed the fix and cut their CDN traffic by 34%! This is the type of win you want to have right out of the gate – something that takes a small amount of work and makes a big improvement.
- Start with Metrics
- I’ve had several engagements where teams got so excited about the optimizations, they started deploying fixes before the metrics were in place. This is bad for two reasons. Without metrics you’re flying blind so you don’t know the actual impact of any fixes. But more importantly, it’s likely that the first fixes you deploy will have the biggest impact. If the metrics aren’t in place then you miss out on quantifying your best work! It’s best to establish the baseline when the site is at its worst. Occasionally teams don’t want to do this because they’re embarrassed by the slowness of the site. Just remind them how happy the execs will be to see a chart showing the site getting twice as fast.
- Identify Your Replacement
- Within the chosen team there needs to be someone who is aligned with you to take over your role. This is the person who keeps the team focused on performance after you’ve moved on to help the next team. He is the one who tracks the dashboards, identifies the changes that were deployed, analyzes the A/B test results, and prioritizes the next optimizations to work on.
- It’s not scalable for you to be the only performance expert in the company. You want to build a virtual performance team that spans all the products in the company. At Yahoo! we called this team the SpeedFreaks. We had regular gatherings, a mailing list, etc. It was a great way to share lessons learned across the different teams and re-energize our excitement about making things faster.
- Get Everyone on Board
- Making and keeping the website fast requires everyone to be thinking about performance. It’s important to keep the entire company involved. There are several ways of doing this. One technique I see often is having realtime dashboards deployed at large gathering spots in the company. The Wall of Fame is another good chart. Eventually teams that are always at the bottom will start wondering what they have to do to get to the top. Getting time during the company all-hands meetings to review current performance and highlight some wins is good. Adding performance (speed) to the annual performance (HR) review form makes everyone think about their contributions in the past and plan on how they can contribute in the future.
- Use Carrot over Stick
- If you follow these tips it’s likely that you’ll start off having successful engagements evangelizing and deploying performance best practices at your company. After working with the choicest teams, however, it’s also likely that you’ll run into a team that just isn’t drinking the WPO kool-aid. This is more likely to happen at larger companies where it’s more challenging to create a cultural shift. If you can’t convince this team to apply the right amount of focus, one possible reaction is to bring in a senior exec to command them to make performance a priority and do the work. This might work in the short term, but will fail in the long term and might even set you further back from where you started.
- Performance is a way of thinking. It requires vigilance. Anyone who has it forced upon them will likely not value performance and will instead look upon it as a nuisance that took them away from their desired focus. This person is now even harder to win over. It’s better to avoid taking the “stick†approach and instead use the “carrot†as motivation – t-shirts, bonuses, executive praise, shout outs at company all-hands, etc. No one enjoys the stick approach – the team doesn’t enjoy it and neither will you. Everyone comes away with negative memories. The carrot approach might not work in the short term, but it leaves the door open for a more positive re-engagement in the future.
- Be Passionate
- It’s likely you’re the “performance lead†within the company, or at least the one who cares the most about making performance a high priority. It’s not going to be easy to get everyone else on board. You can’t go about this half heartedly. You have to be passionate about it. John Rauser spoke (passionately) about this in Creating Cultural Change at Velocity 2010. He says you have to be excited, and relentless. I agree.
Creating a culture of performance at your company is about creating a culture of quality. This is especially true because best (and worst) practices propagate quickly at web companies. Code written for product A is reused by product B. And folks who worked on team A transfer over to team C. If product A is built in a high performance way, those best practices are carried forward by the code and team members. Unfortunately, bad practices spread just as easily.
Companies like Google, Etsy, and Betfair have gone so far as to publish their commitment to performance. This is a win for their customers and for their brand. It’s also a win for the performance community because these companies are more likely to share their best practices and case studies. If your company is focused on performance, please help the community by sharing your lessons learned. If your company doesn’t have a focus on performance, I hope these tips help you establish that WPO focus to create a website that has a better user experience, more traffic, greater revenue, and reduced operating expenses.
Moving beyond window.onload()
[Originally posted in the 2012 Performance Calendar. Reposting here for folks who missed it.]
There’s an elephant in the room that we’ve been ignoring for years:
window.onload is not the best metric for measuring website speed
We haven’t actually been “ignoring†this issue. We’ve acknowledged it, but we haven’t coordinated our efforts to come up with a better replacement. Let’s do that now.
window.onload is so Web 1.0
What we’re after is a metric that captures the user’s perception of when the page is ready. Unfortunately, perception.ready() isn’t on any browser’s roadmap. So we need to find a metric that is a good proxy.
Ten years ago, window.onload was a good proxy for the user’s perception of when the page was ready. Back then, pages were mostly HTML and images. JavaScript, CSS, DHTML, and Ajax were less common, as were the delays and blocked rendering they introduce. It wasn’t perfect, but window.onload was close enough. Plus it had other desirable attributes:
- standard across browsers -Â
window.onload means the same thing across all browsers. (The only exception I’m aware of is that IE 6-9 don’t wait for async scripts before firingÂwindow.onload, while most other browsers do.) - measurable by 3rd parties –
window.onload is a page milestone that can be measured by someone other than the website owner, e.g., metrics services like Keynote Systems and tools like Boomerang. It doesn’t require website owners to add custom code to their pages. - measurable for real users – MeasuringÂ
window.onload is a lightweight operation, so it can be performed on real user traffic without harming the user experience.
Web 2.0 is more dynamic
Fast forward to today and we see that window.onload doesn’t reflect the user perception as well as it once did.
There are some cases where a website renders quickly but window.onload fires much later. In these situations the user perception of the page is fast, but window.onload says the page is slow. A good example of this is Amazon product pages. Amazon has done a great job of getting content that’s above-the-fold to render quickly, but all the below-the-fold reviews and recommendations produce a high window.onload value. Looking at these Amazon WebPagetest results we see that above-the-fold is almost completely rendered at 2.0 seconds, but window.onload doesn’t happen until 5.2 seconds. (The relative sizes of the scrollbar thumbs shows that a lot of content was added below-the-fold.)
 Amazon – 2.0 seconds (~90% rendered) |
 Amazon – 5.2 seconds (onload) |
But the opposite is also true. Heavily dynamic websites load much of the visible page after window.onload. For these websites, window.onload reports a value that is faster than the user’s perception. A good example of this kind of dynamic web app is Gmail. Looking at the WebPagetest results for Gmail we see that window.onload is 3.3 seconds, but at that point only the progress bar is visible. The above-the-fold content snaps into place at 4.8 seconds. It’s clear that in this example window.onload is not a good approximation for the user’s perception of when the page is ready.
 Gmail – 3.3 seconds (onload) |
 Gmail – 4.8 seconds (~90% rendered) |
it’s about rendering, not downloads
The examples above aren’t meant to show that Amazon is fast and Gmail is slow. Nor is it intended to say whether all the content should be loaded before window.onload vs. after. The point is that today’s websites are too dynamic to have their perceived speed reflected accurately by window.onload.
The reason is because window.onload is based on when the page’s resources are downloaded. In the old days of only text and images, the readiness of the page’s content was closely tied to its resource downloads. But with the growing reliance on JavaScript, CSS, and Ajax the perceived speed of today’s websites is better reflected by when the page’s content is rendered. The use of JavaScript and CSS is growing. As the adoption of these dynamic techniques increases, so does the gap between window.onload and the user’s perception of website speed. In other words, this problem is just going to get worse.
The conclusion is clear: the replacement for window.onload must focus on rendering.
what “it†feels like
This new performance metric should take rendering into consideration. It should be more than “first paintâ€. Instead, it should capture when the above-the-fold content is (mostly) rendered.
I’m aware of two performance metrics that exist today that are focused on rendering. Both are available in WebPagetest. Above-the-fold render time (PDF) was developed at Google. It finds the point at which the page’s content reaches its final rendering, with intelligence to adapt for animated GIFs, streaming video, rotating ads, etc. The other technique, called Speed Index and developed by Pat Meenan, gives the “average time at which visible parts of the page are displayedâ€. Both of these techniques use a series of screenshots to do their analysis and have the computational complexity that comes with image analysis.
In other words, it’s not feasible to perform these rendering metrics on real user traffic in their current form. That’s important because, in addition to incorporating rendering, this new metric must maintain the attributes mentioned previously that make window.onload so appealing: standard across browsers, measurable by 3rd parties, and measurable for real users.
Another major drawback to window.onload is that it doesn’t work for single page web apps (like Gmail). These web apps only have one window.onload, but typically have several other Ajax-based “page loads†during the user session where some or most of the page content is rewritten. It’s important that this new metric works for Ajax apps.
ball rolling
I completely understand if you’re frustrated by my lack of implementation specifics. Measuring rendering is complex. The point at which the page is (mostly) rendered is so obvious when flipping through the screenshots in WebPagetest. Writing code that measures that in a consistent, non-impacting way is really hard. My officemate pointed me to this thread from the W3C Web Performance Working Group talking about measuring first paint that highlights some of the challenges.
To make matters worse, the new metric that I’m discussing is likely much more complex than measuring first paint. I believe we need to measure when the above-the-fold content is (mostly) rendered. What exactly is “above-the-fold� What is “mostly�
Another challenge is moving the community away from window.onload. The primary performance metric in popular tools such as WebPagetest, Google Analytics Site Speed, Torbit Insight, SOASTA (LogNormal) mPulse, and my own HTTP Archive is window.onload. I’ve heard that some IT folks even have their bonuses based on the window.onload metrics reported by services like Keynote Systems and Gomez.
It’s going to take time to define, implement, and transition to a better performance metric. But we have to get the ball rolling. Relying on window.onload as the primary performance metric doesn’t necessarily produce a faster user experience. And yet making our websites faster for users is what we’re really after. We need a metric that more accurately tracks our progress toward this ultimate goal.
How fast are we going now?
[This blog post is based on my keynote at the HTML5 Developer Conference. The slides are available on SlideShare and as PPTX.]
I enjoy evangelizing web performance because I enjoy things that are fast (and efficient). Apparently, I’m not the only one. Recent ad campaigns, especially for mobile, tout the virtues of being fast. Comcast uses the words “speed”, “fastest”, “high-speed”, and “lightning-fast” in the Xfinity ads. AT&T’s humorous set of commercials talks about how “faster is better“. iPhone’s new A6 chip is touted as “twice as fast“.
Consumers, as a result of these campaigns selling speed, have higher expectations for the performance of websites they visit. Multiple case studies support the conclusion that a faster website is better received by users and has a positive impact on the business’s bottom line:
- Bing found that searches that were 2 seconds slower resulted in a 4.3% drop in revenue per user.
- When Mozilla shaved 2.2 seconds off their landing page, Firefox downloads increased 15.4%.
- Shopzilla saw conversion rates increase 7-12% as a result of their web performance optimization efforts.
- Making Barack Obama’s website 60% faster increased donation conversions 14%.
Vendors are pitching a faster web. Consumers are expecting a faster web. Businesses succeed with a faster web. But is the Web getting faster? Let’s take a look.
Connection Speed
A key to a faster web experience is a faster Internet connection, but this aspect of web performance often feels like a black box. Users and developers are at the mercy of the ISPs and carrier networks. Luckily, data from Akamai’s State of the Internet shows that connection speeds are increasing.
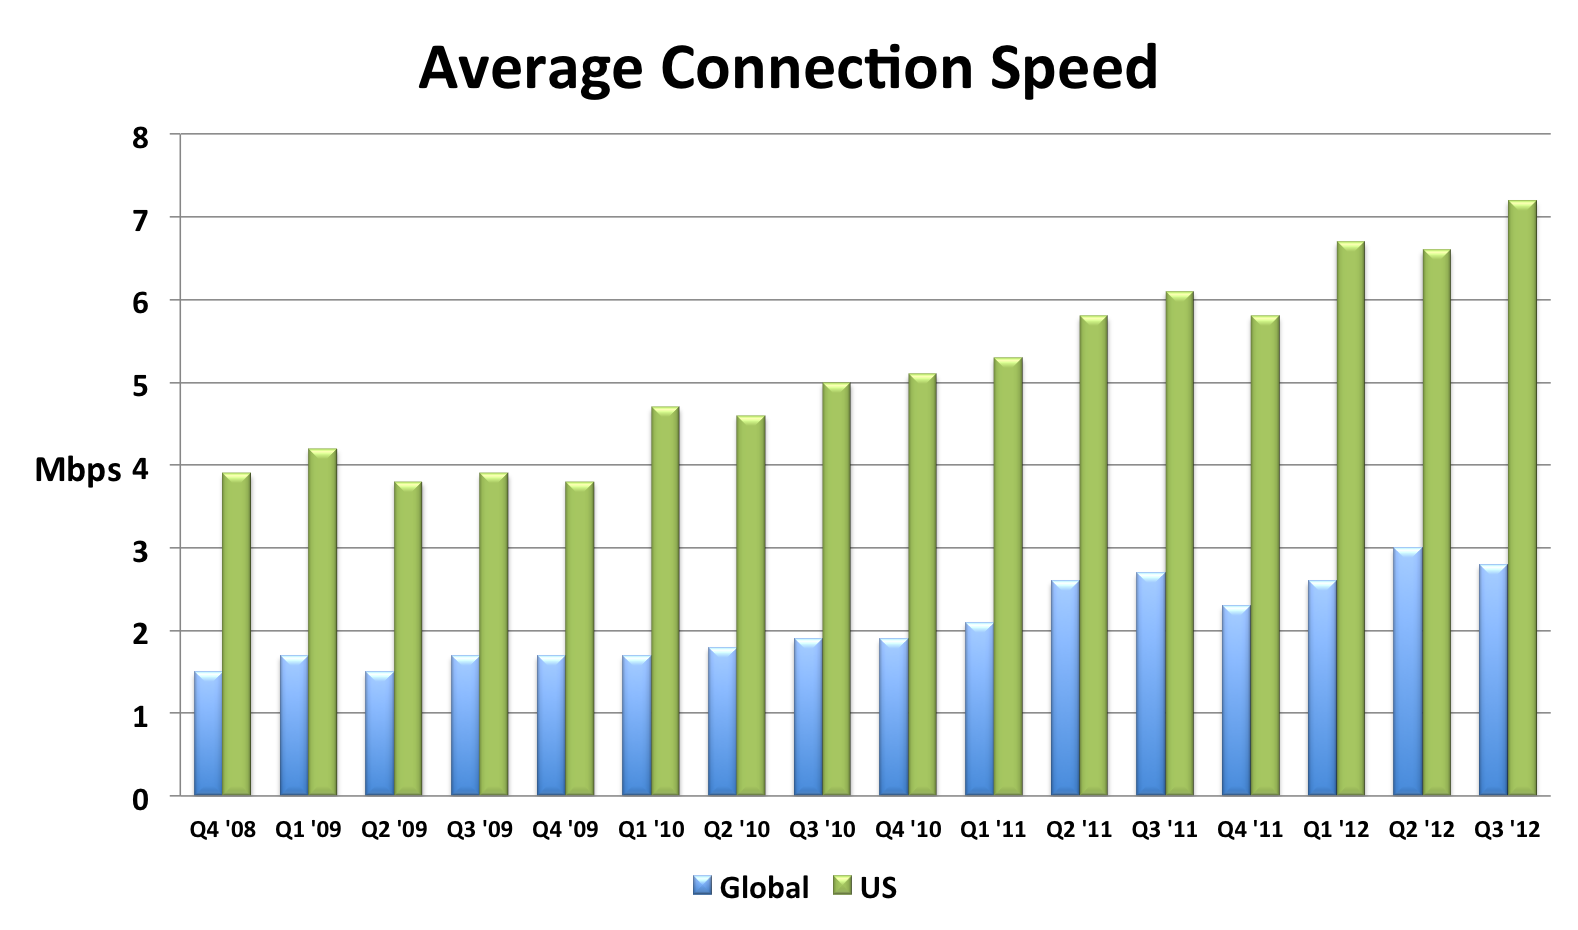
I compiled this chart by extracting the relevant data from each quarterly report. The chart shows that global connection speeds increased 4% and US connection speeds increased 18% over the most recent year that data exists (Q3 2011 to Q3 2012). I also created an Average Mobile Connection Speed chart which tracks three mobile carrier networks. Akamai masks the carrier network name but over the last year the connection speed of these mobile networks increased 30%, 68%, and 131%.
Browsers
Speed is a major feature for browsers. This focus has resulted in many performance improvements over the last few years. In my opinion browser improvements are the biggest contributor to a faster web. I’ll sidestep the contentious debate about which browser is fastest, and instead point out that, regardless of which one you choose, browsers are getting faster with each release.
The following chart shows page load times for major browsers as measured from real users. This report from Gomez is a bit dated (August 2011), but it’s the only real user data I’ve seen broken out by browser. Notice the trends for new releases – page load times improve 15-30%.

The other major benchmark for browsers is JavaScript performance. Below are charts from ZDNet’s browser benchmark report. Except for a regression in Firefox 18, all the trends are showing that browsers get faster with each release.


Page Weight
Web developers don’t have much control over connection speeds and browser optimizations, but they can control the size of their pages. Unfortunately, page weight continues to increase. The data below is from the HTTP Archive for the world’s top 1000 URLs. It shows that transfer size (number of bytes sent over the wire) increased 231K (28%) from March 2012 to March 2013. The biggest absolute increase was in images – growing 114K (23%). The biggest surprise, for me, was the growth in video by 62K (67%). This increase comes from two main factors: more sites are including video and the size of videos are increasing. Video performance is an area that we need to focus on going forward.
| Table 1. Transfer Size Year over Year | |||
| Mar 2012 | Mar 2013 | Δ | |
|---|---|---|---|
| total | 822 K | 1053 K | 231 K (28%) |
| images | 486 K | 600 K | 114 K (23%) |
| JS | 163 K | 188 K | 25 K (15%) |
| video | 92 K | 154 K | 62 K (67%) |
| HTML | 35 K | 42 K | 7 K (20%) |
| CSS | 30 K | 36 K | 6 K (20%) |
| font | 8 K | 18 K | 10 K (125%) |
| other | 8 K | 15 K | 7 K (88%) |
Quality of Craft
There are several “performance quality” metrics tracked in the HTTP Archive. Like page weight, these metrics are something that web developers have more control over. Unfortunately, these metrics were generally flat or trending down for the world’s top 1000 URLs. These metrics are hard to digest in bulk because sometimes higher is better, and other times it’s worse. There’s more detail below but the punchline is 5 of the 7 metrics got worse, and the other two were nearly flat.
| Table 2. Quality of Craft Metrics Year over Year | ||
| Mar 2012 | Mar 2013 | |
|---|---|---|
| PageSpeed Score | 82 | 84 |
| DOM Elements | 1215 | 1330 |
| # of Domains | 15 | 19 |
| Max Reqs on 1 Domain | 40 | 41 |
| Cacheable Resources | 62% | 60% |
| Compressed Responses | 76% | 77% |
| Pages w/ Redirects | 67% | 71% |
Here’s a description of each of these metrics and how they impact web performance.
- PageSpeed Score – PageSpeed is a performance “lint” analysis tool that generates a score from 0 to 100, where 100 is good. YSlow is a similar tool. Year over year the PageSpeed Score increased from 82 to 84, a (small) 2% improvement.
- DOM Elements – The number of DOM elements affects the complexity of a page and has a high correlation to page load times. The number of DOM elements increased from 1215 to 1330, meaning pages are getting more complex.
- # of Domains – The average number of domains per page increased from 15 to 19. More domains means there are more DNS lookups, which slows down the page. This is likely due to the increase in 3rd party content across the Web.
- Max Reqs on 1 Domain – The average top 1000 web page today has 100 requests spread across 19 domains. That averages out to ~5 requests per domain. But the distribution of requests across domains isn’t that even. The HTTP Archive counts how many requests are made for each domain, and then records the domain that has the maximum number of requests – that’s the “Max Reqs on 1 Domain” stat. This increased from 40 to 41. This is a bad trend for performance because most browsers only issue 6 requests in parallel, so it takes seven “rounds” to get through 41 requests. These sites would be better off adopting domain sharding.
- Cacheable Resources – Pages are faster if resources are read from cache, but that requires website owners to set the appropriate caching headers. This stat measures the percentage of requests that had a cache lifetime greater than zero. Unfortunately, the percentage of cacheable resources dropped from 62% to 60%.
- Compressed Responses – The transfer size of text responses (HTML, scripts, stylesheets, etc.) can be reduced ~70% by compressing them. It doesn’t make sense to compress binary data such as images and video. This stat shows the percentage of requests that should be compressed that actually were compressed. The number increased but just slightly from 76% to 77%.
- Pages with Redirects – Redirects slow down pages because an extra roundtrip has to be made to fetch the final response. The percentage of pages with at least one redirect increased from 67% to 71%.
These drops in performance quality metrics is especially depressing to me since evangelizing performance best practices is a large part of my work. It’s especially bad since this only looks at the top 1000 sites which typically have more resources to focus on performance.
User Experience
The ultimate goal isn’t to improve these metrics – it’s to improve the user experience. Unfortunately, we don’t have a way to measure that directly. The metric that’s used as a proxy for the user’s perception of website speed is “page load time” – the time from when the user initiates the request for the page to the time that window.onload fires. Many people, including myself, have pointed out that window.onload is becoming less representative of a web page’s perceived speed, but for now it’s the best we have.
Perhaps the largest repository of page load time data is in Google Analytics. In April 2013 the Google Analytics team published their second report on the speed of the web where they compare aggregate page load times to a year ago. The median page load time on desktops got ~3.5% faster, and on mobile was ~18%Â ~30% faster.

Scorecard
Web pages have gotten bigger. The adoption of performance best practices has been flat or trending down. Connection speeds and browsers have gotten faster. Overall, web pages are faster now than they were a year ago. I think browser vendors deserve most of the credit for this speed improvement. Going forward, web developers will continue to be pushed to add more content, especially 3rd party content, to their sites. Doing this in a way that follows performance best practices will help to make the Web even faster for next year.
I <3 image bytes
Much of my work on web performance has focused on JavaScript and CSS, starting with the early rules Move Scripts to the Bottom and Put Stylesheets at the Top from back in 2007(!). To emphasize these best practices I used to say, “JS and CSS are the most important bytes in the page”.
A few months ago I realized that wasn’t true. Images are the most important bytes in the page.
My focus on JS and CSS was largely motivated by the desire to get the images downloaded as soon as possible. Users see images. They don’t see JS and CSS. It is true that JS and CSS affect what is seen in the page, and even whether and how images are displayed (e.g., JS photo carousels, and CSS background images and media queries). But my realization was JS and CSS are the means by which we get to these images. During page load we want to get the JS and CSS out of the way as quickly as possible so that the images (and text) can be shown.
My main motivation for optimizing JS and CSS is to get rendering to happen as quickly as possible.
Rendering starts very late
With this focus on rendering in mind, I went to the HTTP Archive to see how quickly we’re getting pages to render. The HTTP Archive runs on top of WebPagetest which reports the following time measurements:
- time-to-first-byte (TTFB) – When the first packet of the HTML document arrives.
- start render – When the page starts rendering.
- onload – When window.onload fires.
I extracted the 50th and 90th percentile values for these measurements across the world’s top 300K URLs. As shown, nothing is rendered for the first third of page load time!
| Table 1. Time milestones during page load | |||
| TTFB | start render | onload | |
|---|---|---|---|
| 50th percentile | 610 ms | 2227 ms | 6229 ms |
| 90th percentile | 1780 ms | 5112 ms | 15969 ms |
Preloading
The fact that rendering doesn’t start until the page is 1/3 into the overall page load time is eye-opening. Looking at both the 50th and 90th percentile stats from the HTTP Archive, rendering starts ~32-36% into the page load time. It takes ~10% of the overall page load time to get the first byte. Thus, for ~22-26% of the page load time the browser has bytes to process but nothing is drawn on the screen. During this time the browser is typically downloading and parsing scripts and stylesheets – both of which block rendering on the page.
It used to be that the browser was largely idle during this early loading phase (after TTFB and before start render). That’s because when an older browser started downloading a script, all other downloads were blocked. This is still visible in IE 6&7. Browser vendors realized that while it’s true that constructing the DOM has to wait for a script to download and execute, there’s no reason other resources deeper in the page couldn’t be fetched in parallel. Starting with IE 8 in 2009, browsers started looking past the currently downloading script for other resources (i.e, SCRIPT, IMG, LINK, and IFRAME tags) and preloading those requests in parallel. One study showed preloading makes pages load ~20% faster. Today, all major browsers support preloading. In these Browserscope results I show the earliest version of each major browser where preloading was first supported.
(As an aside, I think preloading is the single biggest performance improvement browsers have ever made. Imagine today, with the abundance of scripts on web pages, what performance would be like if each script was downloaded sequentially and blocked all other downloads.)
Preloading and responsive images
This ties back to this tweet from Jason Grigsby:
I’ll be honest. I’m tired of pushing for resp images and increasingly inclined to encourage devs to use JS to simply break pre-loaders.
The “resp images” Jason refers to are techniques by which image requests are generated by JavaScript. This is generally used to adapt the size of images for different screen sizes. One example is Picturefill. When you combine “pre-loaders” and “resp images” an issue arises – the preloader looks ahead for IMG tags and fetches their SRC, but responsive image techniques typically don’t have a SRC, or have a stub image such as a 1×1 transparent pixel. This defeats the benefits of preloading for images. So there’s a tradeoff:
- Don’t use responsive images so that the preloader can start downloading images sooner, but the images might be larger than needed for the current device and thus take longer to download (and cost more for limited cellular data plans).
- Use responsive images which doesn’t take advantage of preloading which means the images are loaded later after the required JS is downloaded and executed, and the IMG DOM elements have been created.
As Jason says in a follow-up tweet:
The thing that drives me nuts is that almost none of it has been tested. Lots of gospel, not a lot of data.
I don’t have any data comparing the two tradeoffs, but the HTTP Archive data showing that rendering doesn’t start until 1/3 into page load is telling. It’s likely that rendering is being blocked by scripts, which means the IMG DOM elements haven’t been created yet. So at some point after the 1/3 mark the IMG tags are parsed and at some point after that the responsive image JS executes and starts downloading the necessary images.
In my opinion, this is too late in the page load process to initiate the image requests, and will likely cause the web page to render later than it would if the preloader was used to download images. Again, I don’t have data comparing the two techniques. Also, I’m not sure how the preloader works with the responsive image techniques done via markup. (Jason has a blog post that touches on that, The real conflict behind <picture> and @srcset.)
Ideally we’d have a responsive image solution in markup that would work with preloaders. Until then, I’m nervous about recommending to the dev community at large to move toward responsive images at the expense of defeating preloading. I expect browsers will add more benefits to preloading, and I’d like websites to be able to take advantage of those benefits both now and in the future.
HTML5 VIDEO bytes on iOS
HTML5 provides the VIDEO element. It includes the PRELOAD attribute that takes various values such as “none”, “metadata”, and “auto”. Mobile devices ignore all values of PRELOAD in order to avoid high data plan costs, and instead only download the video when the user initiates playback. This is explained in the Safari Developer Library:
In Safari on iOS (for all devices, including iPad), where the user may be on a cellular network and be charged per data unit, preload and autoplay are disabled. No data is loaded until the user initiates it.
However, my testing shows that iOS downloads up to 298K of video data, resulting in unexpected costs to users.
Contradiction?
In my previous post, HTML5 Video Preload, I analyzed how much data is buffered for various values of the VIDEO tag’s PRELOAD attribute. For example, specifying preload='none' ensures no video is preloaded, whereas preload='auto' results in 25 or more seconds of buffered video on desktop browsers depending on the size of the video.
The results for mobile browsers are different. Mobile browsers don’t preload any video data, no matter what PRELOAD value is specified. These preload results are based on measuring the VIDEO element’s buffered property. Using that API shows that zero bytes of data is buffered on all mobile devices including the iPhone. (Look for “Mobile Safari 6” as well as a dozen other mobile devices in the detailed results.)
While it’s true that Mobile Safari on iOS doesn’t buffer any video data as a result of the PRELOAD attribute, it does make other video requests that aren’t counted as “buffered” video. The number and size of the requests and responses depends on the video. For larger videos the total amount of data for these behind-the-scenes requests can be significant.
Unseen VIDEO Requests
[This section contains the technical details of how I found these video requests. Go to Confirming Results, More Observations if you want to skip over these details.]
While testing VIDEO PRELOAD on my iPhone, I noticed that even though the amount of buffered data was “0”, there were still multiple video requests hitting my server. Here are the video requests I see in my Apache access log when I load the test page with preload=’none’ (4M video)Â on my iPhone (iPhone4 iOS6 running standard mobile Safari):
[16/Apr/2013:15:03:48 -0700] "GET /tests/trailer.mp4?t=1366149827 HTTP/1.1" 206 319 "-" "AppleCoreMedia/1.0.0.10B146 (iPhone; U; CPU OS 6_1_2 like Mac OS X; en_us)"
[16/Apr/2013:15:03:48 -0700] "GET /tests/trailer.mp4?t=1366149827 HTTP/1.1" 206 70080 "-" "AppleCoreMedia/1.0.0.10B146 (iPhone; U; CPU OS 6_1_2 like Mac OS X; en_us)"
[16/Apr/2013:15:03:48 -0700] "GET /tests/trailer.mp4?t=1366149827 HTTP/1.1" 206 47330 "-" "AppleCoreMedia/1.0.0.10B146 (iPhone; U; CPU OS 6_1_2 like Mac OS X; en_us)"
There are three requests. They all return a “206 Partial Content” status code. The sizes of the responses shown in the access log are 319 bytes, 70,080 bytes, and 47,330 bytes respectively.
It’s possible that the server sends bytes but the client (my iPhone) doesn’t receive every packet. Since these video requests aren’t reflected using the VIDEO element’s API, I measure the actual bytes sent over the wire using tcpdump and a wifi hotspot. (See the setup details here.) This generates a pcap file that I named mediaevents-iphone.pcap. The first step is to find the connections used to make the video requests using:
tcpdump -qns 0 -A -r mediaevents-iphone.pcap
The output shows the HTTP headers and response data for every request. Let’s find the three video requests.
video request #1
Here’s the excerpt relevant for the first video request (with some binary data removed):
15:03:48.162970 IP 192.168.2.2.49186 > 69.163.242.68.80: tcp 327
GET /tests/trailer.mp4?t=1366149827 HTTP/1.1
Host: stevesouders.com
Range: bytes=0-1
X-Playback-Session-Id: E4C46EAC-17EC-491E-81F7-4EBF4B7BE12B
Accept-Encoding: identity
Accept: */*
Accept-Language: en-us
Connection: keep-alive
User-Agent: AppleCoreMedia/1.0.0.10B146 (iPhone; U; CPU OS 6_1_2 like Mac OS X; en_us)

15:03:48.183732 IP 69.163.242.68.80 > 192.168.2.2.49186: tcp 0
15:03:48.186327 IP 69.163.242.68.80 > 192.168.2.2.49186: tcp 319
HTTP/1.1 206 Partial Content
Date: Tue, 16 Apr 2013 22:03:48 GMT
Server: Apache
Last-Modified: Thu, 13 May 2010 17:49:03 GMT
ETag: "42b795-4867d5fcac1c0"
Accept-Ranges: bytes
Content-Length: 2
Content-Range: bytes 0-1/4372373
Keep-Alive: timeout=2, max=100
Connection: Keep-Alive
Content-Type: video/mp4
I highlighted some important information. This first request for trailer.mp4 occurs on connection #49186. The iPhone only requests bytes 0-1, and the server returns only those two bytes. The Content-Range response header also indicates the total size of the video: 4,372,373 bytes (~4.2M).
video request #2
Here’s the excerpt relevant for the second video request:
15:03:48.325209 IP 192.168.2.2.49186 > 69.163.242.68.80: tcp 333
GET /tests/trailer.mp4?t=1366149827 HTTP/1.1
Host: stevesouders.com
Range: bytes=0-4372372
X-Playback-Session-Id: E4C46EAC-17EC-491E-81F7-4EBF4B7BE12B
Accept-Encoding: identity
Accept: */*
Accept-Language: en-us
Connection: keep-alive
User-Agent: AppleCoreMedia/1.0.0.10B146 (iPhone; U; CPU OS 6_1_2 like Mac OS X; en_us)

15:03:48.349254 IP 69.163.242.68.80 > 192.168.2.2.49186: tcp 1460
HTTP/1.1 206 Partial Content
Date: Tue, 16 Apr 2013 22:03:48 GMT
Server: Apache
Last-Modified: Thu, 13 May 2010 17:49:03 GMT
ETag: "42b795-4867d5fcac1c0"
Accept-Ranges: bytes
Content-Length: 4372373
Content-Range: bytes 0-4372372/4372373
Keep-Alive: timeout=2, max=99
Connection: Keep-Alive
Content-Type: video/mp4
This request also uses connection #49186. The iPhone requests bytes 0-4372372 (the entire video). The Content-Length header implies that 4,372,373 bytes are returned but we’ll soon see it’s much less than that.
video request #3
Here’s the excerpt relevant for the third video request:
15:03:48.409745 IP 192.168.2.2.49187 > 69.163.242.68.80: tcp 339
GET /tests/trailer.mp4?t=1366149827 HTTP/1.1
Host: stevesouders.com
Range: bytes=4325376-4372372
X-Playback-Session-Id: E4C46EAC-17EC-491E-81F7-4EBF4B7BE12B
Accept-Encoding: identity
Accept: */*
Accept-Language: en-us
Connection: keep-alive
User-Agent: AppleCoreMedia/1.0.0.10B146 (iPhone; U; CPU OS 6_1_2 like Mac OS X; en_us)

15:03:48.435684 IP 69.163.242.68.80 > 192.168.2.2.49187: tcp 0
15:03:48.438211 IP 69.163.242.68.80 > 192.168.2.2.49187: tcp 1460
HTTP/1.1 206 Partial Content
Date: Tue, 16 Apr 2013 22:03:48 GMT
Server: Apache
Last-Modified: Thu, 13 May 2010 17:49:03 GMT
ETag: "42b795-4867d5fcac1c0"
Accept-Ranges: bytes
Content-Length: 46997
Content-Range: bytes 4325376-4372372/4372373
Keep-Alive: timeout=2, max=100
Connection: Keep-Alive
Content-Type: video/mp4
The third request is issued on a new connection: #49187. The iPhone requests the last 46,997 bytes of the video. This is likely the video’s metadata (or “moov atom”).
total packet size
I noted the connection #s because in my next step I use those to view the video file packets using this command:
tcpdump -r mediaevents-iphone.pcap | grep -E "(49186|49187)"
Here’s the output. It’s long.
15:03:48.147958 IP 192.168.2.2.49186 > apache2-pat.esp.dreamhost.com.http: Flags [.], ack 1, win 16384, length 0
15:03:48.162970 IP 192.168.2.2.49186 > apache2-pat.esp.dreamhost.com.http: Flags [P.], seq 1:328, ack 1, win 16384, length 327
15:03:48.183732 IP apache2-pat.esp.dreamhost.com.http > 192.168.2.2.49186: Flags [.], ack 328, win 14, length 0
15:03:48.186327 IP apache2-pat.esp.dreamhost.com.http > 192.168.2.2.49186: Flags [P.], seq 1:320, ack 328, win 14, length 319
15:03:48.190322 IP 192.168.2.2.49186 > apache2-pat.esp.dreamhost.com.http: Flags [.], ack 320, win 16364, length 0
15:03:48.325209 IP 192.168.2.2.49186 > apache2-pat.esp.dreamhost.com.http: Flags [P.], seq 328:661, ack 320, win 16384, length 333
15:03:48.349254 IP apache2-pat.esp.dreamhost.com.http > 192.168.2.2.49186: Flags [.], seq 320:1780, ack 661, win 16, length 1460
15:03:48.349480 IP apache2-pat.esp.dreamhost.com.http > 192.168.2.2.49186: Flags [.], seq 1780:3240, ack 661, win 16, length 1460
15:03:48.349520 IP apache2-pat.esp.dreamhost.com.http > 192.168.2.2.49186: Flags [.], seq 3240:4700, ack 661, win 16, length 1460
15:03:48.350034 IP apache2-pat.esp.dreamhost.com.http > 192.168.2.2.49186: Flags [.], seq 4700:6160, ack 661, win 16, length 1460
15:03:48.355531 IP 192.168.2.2.49186 > apache2-pat.esp.dreamhost.com.http: Flags [.], ack 3240, win 16292, length 0
15:03:48.355699 IP 192.168.2.2.49186 > apache2-pat.esp.dreamhost.com.http: Flags [.], ack 6160, win 16110, length 0
15:03:48.366281 IP 192.168.2.2.49186 > apache2-pat.esp.dreamhost.com.http: Flags [F.], seq 661, ack 6160, win 16384, length 0
15:03:48.378012 IP apache2-pat.esp.dreamhost.com.http > 192.168.2.2.49186: Flags [.], seq 6160:7620, ack 661, win 16, length 1460
15:03:48.378086 IP apache2-pat.esp.dreamhost.com.http > 192.168.2.2.49186: Flags [.], seq 7620:9080, ack 661, win 16, length 1460
15:03:48.378320 IP 192.168.2.2.49187 > apache2-pat.esp.dreamhost.com.http: Flags [S], seq 3267277275, win 65535, options [mss 1460,nop,wscale 4,nop,nop,TS val 129308742 ecr 0,sack\
OK,eol], length 0
15:03:48.378417 IP apache2-pat.esp.dreamhost.com.http > 192.168.2.2.49186: Flags [.], seq 9080:10540, ack 661, win 16, length 1460
15:03:48.378675 IP apache2-pat.esp.dreamhost.com.http > 192.168.2.2.49186: Flags [.], seq 10540:12000, ack 661, win 16, length 1460
15:03:48.379705 IP apache2-pat.esp.dreamhost.com.http > 192.168.2.2.49186: Flags [.], seq 12000:13460, ack 661, win 16, length 1460
15:03:48.379760 IP apache2-pat.esp.dreamhost.com.http > 192.168.2.2.49186: Flags [.], seq 13460:14920, ack 661, win 16, length 1460
15:03:48.383237 IP 192.168.2.2.49186 > apache2-pat.esp.dreamhost.com.http: Flags [R], seq 3028115607, win 0, length 0
15:03:48.383430 IP 192.168.2.2.49186 > apache2-pat.esp.dreamhost.com.http: Flags [R], seq 3028115607, win 0, length 0
15:03:48.383761 IP 192.168.2.2.49186 > apache2-pat.esp.dreamhost.com.http: Flags [R], seq 3028115607, win 0, length 0
15:03:48.384064 IP 192.168.2.2.49186 > apache2-pat.esp.dreamhost.com.http: Flags [R], seq 3028115607, win 0, length 0
15:03:48.384297 IP 192.168.2.2.49186 > apache2-pat.esp.dreamhost.com.http: Flags [R], seq 3028115607, win 0, length 0
15:03:48.385553 IP 192.168.2.2.49186 > apache2-pat.esp.dreamhost.com.http: Flags [R], seq 3028115607, win 0, length 0
15:03:48.399069 IP apache2-pat.esp.dreamhost.com.http > 192.168.2.2.49187: Flags [S.], seq 277046834, ack 3267277276, win 5840, options [mss 1460,nop,nop,sackOK,nop,wscale 9], len\
gth 0
15:03:48.401299 IP 192.168.2.2.49187 > apache2-pat.esp.dreamhost.com.http: Flags [.], ack 1, win 16384, length 0
15:03:48.409745 IP 192.168.2.2.49187 > apache2-pat.esp.dreamhost.com.http: Flags [P.], seq 1:340, ack 1, win 16384, length 339
15:03:48.435684 IP apache2-pat.esp.dreamhost.com.http > 192.168.2.2.49187: Flags [.], ack 340, win 14, length 0
15:03:48.438211 IP apache2-pat.esp.dreamhost.com.http > 192.168.2.2.49187: Flags [.], seq 1:1461, ack 340, win 14, length 1460
15:03:48.438251 IP apache2-pat.esp.dreamhost.com.http > 192.168.2.2.49187: Flags [.], seq 1461:2921, ack 340, win 14, length 1460
15:03:48.438671 IP apache2-pat.esp.dreamhost.com.http > 192.168.2.2.49187: Flags [.], seq 2921:4381, ack 340, win 14, length 1460
15:03:48.444261 IP 192.168.2.2.49187 > apache2-pat.esp.dreamhost.com.http: Flags [.], ack 2921, win 16201, length 0
15:03:48.446763 IP 192.168.2.2.49187 > apache2-pat.esp.dreamhost.com.http: Flags [.], ack 4381, win 16384, length 0
15:03:48.464208 IP apache2-pat.esp.dreamhost.com.http > 192.168.2.2.49187: Flags [.], seq 4381:5841, ack 340, win 14, length 1460
15:03:48.464589 IP apache2-pat.esp.dreamhost.com.http > 192.168.2.2.49187: Flags [.], seq 5841:7301, ack 340, win 14, length 1460
15:03:48.465088 IP apache2-pat.esp.dreamhost.com.http > 192.168.2.2.49187: Flags [.], seq 7301:8761, ack 340, win 14, length 1460
15:03:48.469165 IP apache2-pat.esp.dreamhost.com.http > 192.168.2.2.49187: Flags [.], seq 8761:10221, ack 340, win 14, length 1460
15:03:48.469269 IP apache2-pat.esp.dreamhost.com.http > 192.168.2.2.49187: Flags [.], seq 10221:11681, ack 340, win 14, length 1460
15:03:48.474194 IP 192.168.2.2.49187 > apache2-pat.esp.dreamhost.com.http: Flags [.], ack 7301, win 16201, length 0
15:03:48.474491 IP 192.168.2.2.49187 > apache2-pat.esp.dreamhost.com.http: Flags [.], ack 10221, win 16019, length 0
15:03:48.481544 IP 192.168.2.2.49187 > apache2-pat.esp.dreamhost.com.http: Flags [.], ack 11681, win 16384, length 0
15:03:48.495319 IP apache2-pat.esp.dreamhost.com.http > 192.168.2.2.49187: Flags [.], seq 11681:13141, ack 340, win 14, length 1460
15:03:48.495878 IP apache2-pat.esp.dreamhost.com.http > 192.168.2.2.49187: Flags [.], seq 13141:14601, ack 340, win 14, length 1460
15:03:48.495928 IP apache2-pat.esp.dreamhost.com.http > 192.168.2.2.49187: Flags [.], seq 14601:16061, ack 340, win 14, length 1460
15:03:48.500477 IP apache2-pat.esp.dreamhost.com.http > 192.168.2.2.49187: Flags [.], seq 16061:17521, ack 340, win 14, length 1460
15:03:48.500542 IP apache2-pat.esp.dreamhost.com.http > 192.168.2.2.49187: Flags [.], seq 17521:18981, ack 340, win 14, length 1460
15:03:48.500743 IP apache2-pat.esp.dreamhost.com.http > 192.168.2.2.49187: Flags [.], seq 18981:20441, ack 340, win 14, length 1460
15:03:48.503543 IP 192.168.2.2.49187 > apache2-pat.esp.dreamhost.com.http: Flags [.], ack 14601, win 16201, length 0
15:03:48.504110 IP 192.168.2.2.49187 > apache2-pat.esp.dreamhost.com.http: Flags [.], ack 17521, win 16019, length 0
15:03:48.508600 IP 192.168.2.2.49187 > apache2-pat.esp.dreamhost.com.http: Flags [.], ack 20441, win 16201, length 0
15:03:48.524397 IP apache2-pat.esp.dreamhost.com.http > 192.168.2.2.49187: Flags [.], seq 20441:21901, ack 340, win 14, length 1460
15:03:48.524753 IP apache2-pat.esp.dreamhost.com.http > 192.168.2.2.49187: Flags [.], seq 21901:23361, ack 340, win 14, length 1460
15:03:48.524773 IP apache2-pat.esp.dreamhost.com.http > 192.168.2.2.49187: Flags [.], seq 23361:24821, ack 340, win 14, length 1460
15:03:48.525207 IP apache2-pat.esp.dreamhost.com.http > 192.168.2.2.49187: Flags [.], seq 24821:26281, ack 340, win 14, length 1460
15:03:48.525756 IP apache2-pat.esp.dreamhost.com.http > 192.168.2.2.49187: Flags [.], seq 26281:27741, ack 340, win 14, length 1460
15:03:48.533224 IP 192.168.2.2.49187 > apache2-pat.esp.dreamhost.com.http: Flags [.], ack 23361, win 16201, length 0
15:03:48.533395 IP 192.168.2.2.49187 > apache2-pat.esp.dreamhost.com.http: Flags [.], ack 26281, win 16019, length 0
15:03:48.533553 IP 192.168.2.2.49187 > apache2-pat.esp.dreamhost.com.http: Flags [.], ack 27741, win 16384, length 0
15:03:48.533714 IP apache2-pat.esp.dreamhost.com.http > 192.168.2.2.49187: Flags [.], seq 27741:29201, ack 340, win 14, length 1460
15:03:48.534656 IP apache2-pat.esp.dreamhost.com.http > 192.168.2.2.49187: Flags [.], seq 29201:30661, ack 340, win 14, length 1460
15:03:48.534753 IP apache2-pat.esp.dreamhost.com.http > 192.168.2.2.49187: Flags [.], seq 30661:32121, ack 340, win 14, length 1460
15:03:48.534835 IP apache2-pat.esp.dreamhost.com.http > 192.168.2.2.49187: Flags [.], seq 32121:33581, ack 340, win 14, length 1460
15:03:48.535268 IP apache2-pat.esp.dreamhost.com.http > 192.168.2.2.49187: Flags [.], seq 33581:35041, ack 340, win 14, length 1460
15:03:48.535933 IP apache2-pat.esp.dreamhost.com.http > 192.168.2.2.49187: Flags [.], seq 35041:36501, ack 340, win 14, length 1460
15:03:48.540701 IP 192.168.2.2.49187 > apache2-pat.esp.dreamhost.com.http: Flags [.], ack 30661, win 16292, length 0
15:03:48.540792 IP 192.168.2.2.49187 > apache2-pat.esp.dreamhost.com.http: Flags [.], ack 33581, win 16110, length 0
15:03:48.540966 IP 192.168.2.2.49187 > apache2-pat.esp.dreamhost.com.http: Flags [.], ack 36501, win 15927, length 0
15:03:48.555942 IP apache2-pat.esp.dreamhost.com.http > 192.168.2.2.49187: Flags [.], seq 36501:37961, ack 340, win 14, length 1460
15:03:48.556276 IP apache2-pat.esp.dreamhost.com.http > 192.168.2.2.49187: Flags [.], seq 37961:39421, ack 340, win 14, length 1460
15:03:48.556767 IP apache2-pat.esp.dreamhost.com.http > 192.168.2.2.49187: Flags [.], seq 39421:40881, ack 340, win 14, length 1460
15:03:48.556810 IP apache2-pat.esp.dreamhost.com.http > 192.168.2.2.49187: Flags [.], seq 40881:42341, ack 340, win 14, length 1460
15:03:48.557342 IP apache2-pat.esp.dreamhost.com.http > 192.168.2.2.49187: Flags [.], seq 42341:43801, ack 340, win 14, length 1460
15:03:48.557818 IP apache2-pat.esp.dreamhost.com.http > 192.168.2.2.49187: Flags [.], seq 43801:45261, ack 340, win 14, length 1460
15:03:48.565012 IP 192.168.2.2.49187 > apache2-pat.esp.dreamhost.com.http: Flags [.], ack 39421, win 16201, length 0
15:03:48.565188 IP 192.168.2.2.49187 > apache2-pat.esp.dreamhost.com.http: Flags [.], ack 42341, win 16019, length 0
15:03:48.565232 IP 192.168.2.2.49187 > apache2-pat.esp.dreamhost.com.http: Flags [.], ack 45261, win 15836, length 0
15:03:48.565417 IP apache2-pat.esp.dreamhost.com.http > 192.168.2.2.49187: Flags [.], seq 45261:46721, ack 340, win 14, length 1460
15:03:48.565477 IP apache2-pat.esp.dreamhost.com.http > 192.168.2.2.49187: Flags [P.], seq 46721:47331, ack 340, win 14, length 610
15:03:48.571326 IP 192.168.2.2.49187 > apache2-pat.esp.dreamhost.com.http: Flags [.], ack 46721, win 16384, length 0
15:03:48.571664 IP 192.168.2.2.49187 > apache2-pat.esp.dreamhost.com.http: Flags [.], ack 47331, win 16345, length 0
15:03:50.444574 IP apache2-pat.esp.dreamhost.com.http > 192.168.2.2.49187: Flags [F.], seq 47331, ack 340, win 14, length 0
15:03:50.471892 IP 192.168.2.2.49187 > apache2-pat.esp.dreamhost.com.http: Flags [.], ack 47332, win 16384, length 0
There’s a lot of interesting things to see in there, but staying on task let’s figure out how much video data was actually received by the iPhone. We’ll look at packets sent from the server (dreamhost.com) to my iPhone (192.168.2.2) and add up the length values. The total comes to 62,249 bytes (~61K). Separating it by request comes to 319 bytes for the first response, 14,600 bytes for the second response, and 47,330 bytes for the third response. Let’s compare this true byte size to what we saw in the Apache access logs and what was in the Content-Length response headers:
| Apache access log | Content-Length | actual bytes received | |
|---|---|---|---|
| request #1 | 319 bytes | 2 bytes | 319 bytes |
| request #2 | 70,080 bytes | 4,372,373Â bytes | 14,600 bytes |
| request #3 | 47,330 bytes | 46,997 bytes | 47,330 bytes |
What this tells us is you can’t always trust what is shown in the server access logs and even the Content-Length headers. The sizes of requests 1 and 3 are consistent when you take into account that the size of headers is not included in the Content-Length. Request #2’s sizes are all over the place. Looking at the packets in more detail reveals why: the iPhone tried to close the connection after receiving 5,840 bytes and then finally reset the connection after 14,600 bytes. Thus, the actual amount of data downloaded was different than what the access log and Content-Length indicated.
The point is, some days you have to drop down into tcpdump and pcap files to get the truth. For this ~4M video looking at the pcap files shows that iOS downloaded ~61K of video data. (Thanks to Arvind Jain for helping me decipher the pcap files!)
Confirming Results, More Observations
Here are some additional observations from my testing.
Larger videos => more data: The amount of data the iPhone downloads increases for larger videos. The preload=’none’ test page for the 62M video generates seven video requests. Using the same tcpdump technique shows this larger video resulted in 304,918 bytes (~298K) of video data being downloaded.
Data not “re-used”: To make matters worse, this video data that is downloaded behind-the-scenes doesn’t reduce the download size when the user initiates playback. To test this I started a new tcpdump capture and started playing the 4.2M video. This resulted in downloading 4,401,911 bytes (~4.2M) – the size of the entire video.
Happens on cell networks: All of the tests so far were done over wifi, but data plan costs only occur over mobile networks. One possibility is that the iPhone downloads this video data on wifi, but not over carrier networks. Unfortunately, that’s not the case. I tested this by turning off wifi on my iPhone, closing all apps, resetting my cellular usage statistics, and loading the test pages five times.
For the test page with preload=’none’ (4M video) the amount of Received cellular data is 354K for all five page loads, or ~71K per page. The test page without the VIDEO tag is ~8K, so this closely matches the earlier findings that ~61K of video data is being downloaded in the background. For the preload=’none’ test page for the 62M video the amount of Received cellular data is 1.6M for five page loads, or ~320K per page. After accounting for the size of the test page and rounding errors this is close to the ~298K of video data that was found for this larger file. The conclusion is that these unseen video requests occur when the iPhone is on a cellular network as well as on wifi.
Only happens on iOS: These extraneous video requests don’t happen on my Samsung Galaxy Nexus (Android 4.2.2) using the default Android Browser as well as Chrome for Android 26. Because the tests are so hands-on I can’t test other phones jammers using Browserscope. However, knowing that a dozen or so different mobile devices ran the test on my server I searched through my access logs from the point where I published the HTML5 Video Preload blog post to see if any of them generated requests for trailer.mp4. The only ones that showed up were iPhone and iPad, suggesting that none of the other mobile devices generate these background video requests.
Strange User-Agents, no Referer: The User-Agent request header for mobile Safari on my iPhone is:
Mozilla/5.0 (iPhone; CPU iPhone OS 6_1_2 like Mac OS X) AppleWebKit/536.26 (KHTML, like Gecko) Version/6.0 Mobile/10B146 Safari/8536.25
But the User-Agent for the video requests is:
AppleCoreMedia/1.0.0.10B146 (iPhone; U; CPU OS 6_1_2 like Mac OS X; en_us)
They’re different!
My Galaxy Nexus has similar behavior. The User-Agent for Android browser is:
Mozilla/5.0 (Linux; U; Android 4.2.2; en-us; Galaxy Nexus Build/JDQ39) AppleWebKit/534.30 (KHTML, like Gecko) Version/4.0 Mobile Safari/534.30
Chrome for Android is:
Mozilla/5.0 (Linux; Android 4.2.2; Galaxy Nexus Build/JDQ39) AppleWebKit/537.31 (KHTML, like Gecko) Chrome/26.0.1410.58 Mobile Safari/537.31
But both send this User-Agent when requesting video:
stagefright/1.2 (Linux;Android 4.2.2)
It’s good to keep this in mind when investigating video requests on mobile. Another hassle is that all three of these mobile browsers omit the Referer request header. This seems like a clear oversight that makes it hard to correlate video playback with page views.
No Good Workaround
I mentioned this blog post to my officemate and he pointed out Jim Wilson’s comments in his post on Breaking the 1000ms Time to Glass Mobile Barrier. It appears Jim also saw this unseen video requests issue. He went further to find a way to avoid bandwidth contention:
We found that if the <video> tag had any information at all, the mobile device would try to oblige it. What we wanted was for something to start happening right away (e.g. showing the poster) but if we gave the video tag something to chew on it would slow down the device. From the user’s perspective nothing was happening.
So our latest version inlines critical styles into the head, uses a <div> with background:url() for the poster, has an empty <video> tag, dynamically loads Video.js, and when it’s done (onready/onload) sets the source through the Video.js api.
I added the emphasis to highlight his solution. The VIDEO tag’s markup doesn’t specify the SRC attribute. This avoids any behind-the-scenes video requests on iOS that contend for bandwidth with resources that are visible in the page (such as the POSTER image). The SRC is set later via JavaScript.
While this technique avoids the issue of bandwidth contention, it doesn’t avoid the extra video requests. When the SRC is set later it results in video data being downloaded. In fact, when I tested this technique it actually resulted in more video data being downloaded leading to even higher data costs.
It’s possible that moving the metadata to the front of the video file may reduce the amount of data downloaded. The 19M video from Video.js is formatted this way and downloads less video data than my 4M test video. Arranging the MP4 data more efficiently should be further investigated to see if it can reduce the amount of data downloaded.
Conclusion
When the HTML5 VIDEO tag is used, iOS downloads video data without the user initiating playback. In the tests described here the amount of video data downloaded ranged from 61K to 298K. This behavior differs from other mobile devices. This means simply visiting a page that uses the VIDEO element on an iPhone or iPad could result in unexpected cellular network data charges. Unfortunately, there’s no good workaround to avoid these extra video requests. I’ve submitted a bug to Apple asking that iOS avoid these extra data costs similar to other mobile devices.
HTML5 Video Preload
At last week’s HTML5 Developer Conference I attended Philippe Le Hegaret‘s session on “Video in the Open Web Platform”. Since the amount of video on the Web is growing (more details in a future post), I wondered if the VIDEO tag’s preload behavior could account for that. Maybe its default behavior is to preload aggressively.
The VIDEO PRELOAD attribute has the following possible states:
- no preload attribute
- Preload is not specified.
preload='none'- From the spec, “Hints to the UA that the user is not expected to need the video, or that minimizing unnecessary traffic is desirable.”
preload='metadata'- “Hints to the UA that the user is not expected to need the video, but that fetching its metadata (dimensions, first frame, track list, duration, and so on) is desirable.”
preload='auto'- “Hints to the UA that optimistically downloading the entire video is considered desirable.”
preloadorpreload=''- The preload attribute is specified but no value is given. Specifying the empty string is the same as specifying “auto”.
I created an HTML5 Video test page based on Philippe’s test page. The test page includes a VIDEO tag. Clicking on the various test links changes the state of the PRELOAD attribute. JavaScript measures how much of the video is buffered. The entire video is 52.2 seconds long. The final result is the number of seconds that are buffered (preloaded).
In order to gather results across various browsers I connected the test page to a Browserscope user test and tweeted asking people to run the test page. (There were some race conditions in the test page that I resolved after an awesome realtime, tweet-driven debug session with voluntary testers. It was very cool.) A subset of major browsers is shown in Table 1. You can see the full results in Browserscope.
| Table 1. Seconds of Video Preloaded | ||||||
| browser | no preload attr | preload ='none' |
preload= 'metadata' |
preload ='auto' |
preload ='' |
autoplay |
|---|---|---|---|---|---|---|
| Android 4 | 0 s | 0 s | 0 s | 0 s | 0 s | 0 s |
| Chrome 26 | 25 s | 0 s | 25 s | 25 s | 25 s | 52 s |
| Firefox 19 | 0 s | 0 s | 0 s | 53 s | 53 s | 53 s |
| IEÂ 9 | 2 s | 0 s | 2 s | 52 s | 52 s | 52 s |
| IEÂ 10 | 0 s | 0 s | 0 s | 52 s | 52 s | 52 s |
| iPhone iOS6 | 0 s | 0 s | 0 s | 0 s | 0 s | 0 s |
| Opera 12 | 10 s | 0 s | 10 s | 53 s | 53 s | 53 s |
| Safari 6 | 52 s | 0 s | 0 s | 52 s | 52 s | 52 s |
Observation #1: Mobile devices don’t preload anything. The VIDEO spec calls the preload values “hints”, so it makes sense that mobile browsers would choose not to preload anything in order to save on data costs. Instead, the video doesn’t start downloading until the user initiates playback. When I saw this I decided to add a test for the AUTOPLAY attribute. As shown, that also does not cause any video download on mobile devices.
Observation #2: The amount of video preloaded varies across the major desktop browsers. Luckily, preload='none' has consistent behavior across all browsers: nothing is buffered. But all other values of PRELOAD vary in how much video data is downloaded. Chrome is aggressive about preloading, going so far as to buffer 25 seconds of video for preload='metadata'. However, it is less aggressive for preload='auto', stopping at 25 seconds while the other desktop browsers download the entire 52 seconds. Firefox 19 and IE 10 are generally less aggressive, buffering zero seconds for three of five preload states.
Observation #3: Browsers preload too much by default. Developers are most likely not going to specify any value for PRELOAD. As shown in Table 1, this situation results in IE 9 buffering 2 seconds of video, Opera 12 buffers 10 seconds, Chrome 26 buffers 25 seconds, and Safari 6 buffers the entire 52 seconds. The entire video is 4.2MB, so the amount of data downloaded is 0.2MB for IE9, 0.8MB for Opera 12, 2.0MB for Chrome 26, and the entire 4.2MB for Safari 6.
Looking at the Top 1000 URLs worldwide, only a handful use the VIDEO tag. Most sites are still using the Flash player, which has its own preloading behavior. But as use of the VIDEO tag increases, it would be good to determine how much video should be buffered for various values of preload, especially for the default case of no PRELOAD attribute. I suggest guidance be given to drive that to a lower number, possibly 5 to 10 seconds. If a developer wants to have the video preload, specifying PRELOAD is just an attribute away.
Page weight grows 24% year-over-year (not 44%)
SHORT: Earlier this week I reported that the average page weight for the Alexa Top 1000 websites increased 44% in 1 year. The actual stat is 24%.
LONG: On Monday I delivered a keynote at the HTML5 Developer Conference entitled “How fast are we going now?” (slides available on SlideShare and as PPTX). I talked about several aspects of “fast” – connection speeds, browser performance, page load times, code quality, and page weight. (I’ll publish a blog post version of that talk next week.)
I gathered the page weight stats from the HTTP Archive – a project I run that’s been gathering web metrics for the past 2.5 years. The specific chart I referred to was Total Transfer Size & Total Requests for the Alexa Top 1000 URLs from March 15 2012 to March 15 2013:
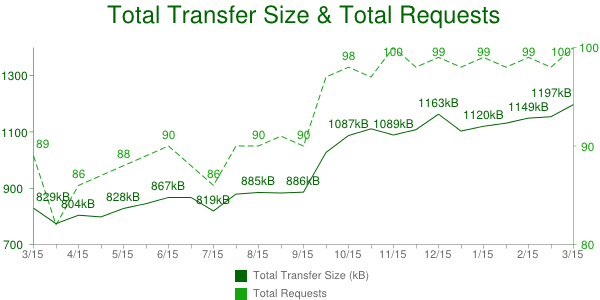
As shown in this chart, the average transfer size for these Top 1000 pages grew from 829 kB to 1197 kB year-over-year, an increase of 368 kB or 44%. However, there’s also a noticeable jump around October 1 2012. I flagged this for later investigation while I rushed to finish my slides.
After the keynote I dug deeper to find the cause of that jump and discovered that it was due to a change in the test environment. Previously the network traffic for each page was recorded up until document complete (window.onload). On October 1 2012 the test configuration was changed to include HTTP requests that occurred after document complete. This is why the total transfer size jumped – the window of time being monitored was increased resulting in more HTTP requests being counted.
As a result, this trend chart is comparing apples and oranges, and so was I. Luckily all the data in the HTTP Archive is, well, archived, so I was able to go back and recompute the stats to get an apples-to-apples comparison. The total transfer size up to document complete is 829 kB for March 15 2012 and 1031 kB for March 15 2013. That’s an increase of 202 kB or 24%.
I feel terrible about making this mistake, but I feel even worse about the folks who were kind enough to spread the word via Twitter and other forums. They did so, in part, based on a level of trust that what I say is accurate. I’m a stickler for details. This mistake is out of character and I’ll work harder to avoid similar mistakes in the future.
Specific steps that I’m taking:
- Don’t rush to release stats without investigating anomalies – rookie mistake.
- Track changes to the environment better – I do this now in the HTTP Archive News page but have not been keeping it up-to-date. I’ve updated it and will keep it current going forward.
- Annotate charts to indicate when changes were made – This has been a long-standing bug. I need to completely revamp all the charts and will tackle this as part of that change.
- A final issue is what to do with these transfer size charts. I believe it’s a better reflection of the Web to include lazy-loaded resources. That’s a newer trend that is getting wider adoption. So I want this chart to reflect the stats we’re currently collecting. Unfortunately, the total transfer size including post-onload resources isn’t available retroactively because the tests conducted prior to Oct 1 2012 were stopped at window.onload – that later network activity wasn’t archived. As a result, comparing transfer sizes before and after Oct 1 2012 is apples-and-oranges. Adding chart annotations would fix that. In the near term I’ve added the following footnote below each transfer size chart containing a link to an FAQ item with more info: “Transfer sizes prior to Oct 1 2012 are smaller due to a change in testing.”
The HTTP Archive is a great resource for trends in web performance. Mistakes are rare. I apologize for this error especially to those who forwarded the mistaken info.
But back to the correct stat – 24% is still too big! The previous year saw a 25% increase (transfer size up to document complete for the Top 1000 URLs Mar 15 2011 to Mar 15 2012). Video plays an interesting role in this increase. Watch for my blog post next week for more info.
Mobile waterfalls
I often scan the mobile dev tools landscape and get flashbacks to 2005 when debugging and profiling in desktop browsers was nigh impossible. This was before Firebug when alert was the primary means of debugging.
woe is mobile dev tools
Most of the tools that exist for desktop web development are also needed on mobile. That’s obvious. And yet, despite more than six years of mobile web development many necessary tools are still missing. Browser vendors and tool hackers should just walk through the most useful desktop dev tools and make sure they’re available on mobile.
But it’s complicated. Extensions for mobile browsers are hindered by, well, the absence of an extensions API. While Firefox for Android and Opera Mobile support extensions, Chrome for Android and Mobile Safari do not. The lack of an extensions API for these popular browsers is a setback. It can be worked around by writing mobile apps that use OS hooks to capture the information needed by web developers, but those types of apps are likely to run afoul of app store approval processes, and in some cases the OS hooks aren’t available.
I chose to create the Mobile Perf bookmarklet as a way to get dev tools on all mobile devices. The Mobile Perf bookmarklet is an uber-bookmarklet that includes these other tools: Firebug Lite, Page Resources, Docsource, DOM Monster, Storager, YSlow, SpriteMe, and CSSess. These tools are great, but they’re just JavaScript running in the page and don’t have access to the browser’s internals. For example, Firebug Lite includes a console and DOM walker, but doesn’t support JavaScript debugging and profiling.
Mobile browser vendors have provided remote debuggers in the last year or two. These include Chrome for Android, Opera Dragonfly, Firefox for Android, and iOS Safari. These remote debuggers have more detailed information and more powerful features, but they all require a separate laptop and the setup is a bit complex.
my kingdom for a (mobile) waterfall chart
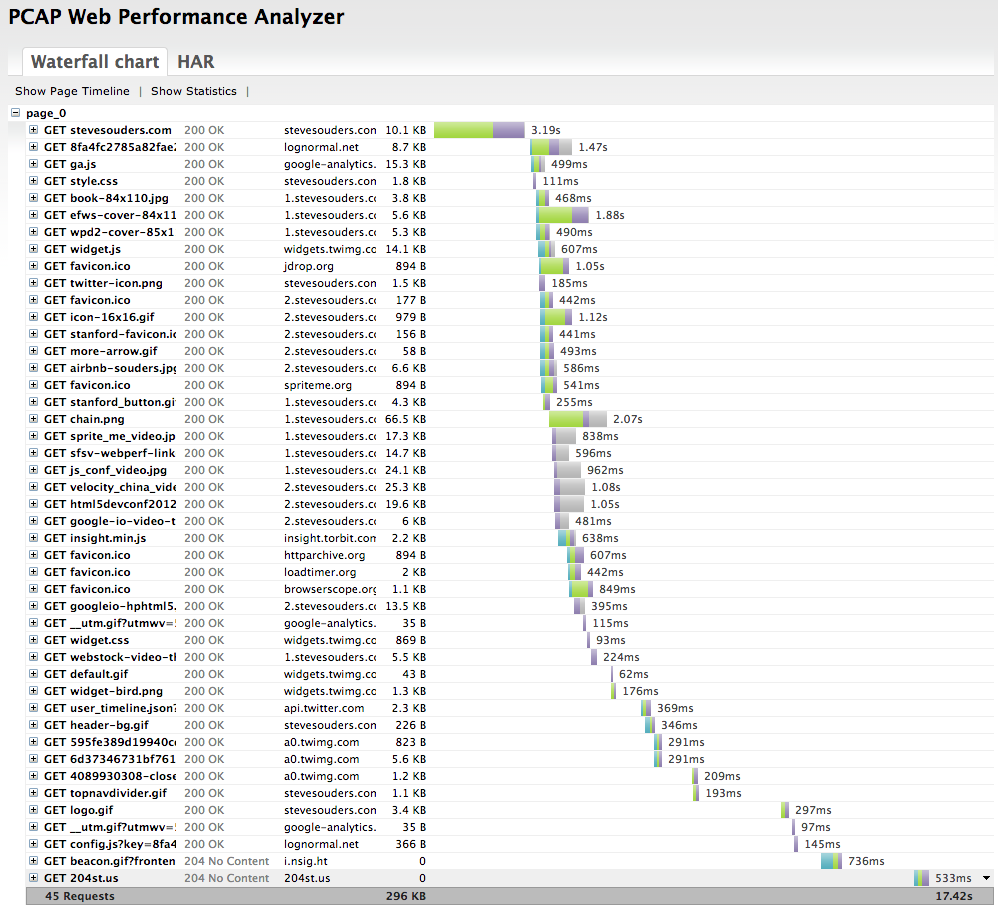
As a performance engineer my primary analysis tool is a waterfall chart. All major desktop browsers have embedded dev tools for generating waterfall charts. There are also out-of-browser tools, such as HttpWatch. Here’s an example waterfall chart from Chrome 25 for my website:

It took me about 3 minutes to generate this waterfall chart – and that includes the time to capture the screenshot and upload it to my server. While it’s easy to generate waterfall charts on the desktop, it’s much more time consuming to do this for mobile devices. The main solution for getting mobile waterfall charts is to use a remote debugger, but this is complicated:
- I don’t have every remote debugger installed on my laptop.
- Even if I have the appropriate remote debugger, they take time to setup and connect for each mobile device.
- There might not be a remote debugger for my particular mobile device.
my solution
The solution I would prefer is to have mobile browsers generate waterfall charts natively with the option to export them to a remote server for later analysis on a larger screen. (If you work on a mobile browser please add this!) Until this becomes a standard feature, I generate mobile waterfall charts by running tcpdump on my laptop and connecting my mobile device to it via a wifi hotspot.
This solution is as complex as setting up a remote debugger. In fact, it’s probably more complex. But it works for all mobile devices. Once I get it set up I can walk through all my various mobile devices to gather waterfall charts.
In the remainder of this blog post I’ll go over the specific step-by-step instructions for gathering mobile waterfall charts using this approach. The initial steps are heavily based on the pcaphar CaptureMobileTraffics page, but I go further to explain how to do this without a LAN connection going through a portable hotspot. These instructions are based on using my MacBook Air running 10.8.3.
1: wifi hotspot
I start by creating a wifi hotspot on my MacBook Air. This step assumes you’re connected to the Internet using an Ethernet connection. On my MacBook Air this is done using an Apple USB Ethernet Adaptor (aka, “dongle”).
- Open a shell terminal and run
ifconfig -a. Save the output – we’ll refer to it later. - Click on the Apple icon -> System Preferences…
- Click on “Sharing” in the Internet & Wireless section.
- Make sure the “Internet Sharing” service is highlighted on the left, but don’t select the checkbox just yet. (If the controls are disabled remember to click on the lock to enter the admin password.)
- For “Share your connection from:” select “USB Ethernet”. (This is where my laptop is getting its connection to the Internet.)
- For “To computers using:” select “Wi-Fi”. (This is where my laptop is sharing it’s Internet connection with others.)
- Click “Wi-Fi Options…”.
- For “Network Name:” I’ll enter “ss-laptop”.
- Leave “Security:” at “WPA2 Personal”.
- Enter an 8 character password.
- Click OK to save these Wi-Fi options.
- Select the checkbox next to “Internet Sharing” and choose “Start” when prompted.
The wifi hotspot should be active at this point. Connect your mobile device to the wifi hotspot you specified in step #6a, in my case “ss-laptop”. Navigate to some web pages on your mobile device to make sure it has an Internet connection.
To be certain my mobile device doesn’t fallback to the carrier network I often disable mobile data. On the iPhone (iOS 6) this is under Settings -> General -> Cellular. On my Samsung Galaxy Nexus (Android 4) this is under Settings -> Wireless & Networks More… -> Mobile networks.
You can confirm that your mobile device is using the laptop’s Internet connection by loading my HTTP Stuff page on both and making sure they have the same value for REMOTE_ADDR.
2: tcpdump
In this step we’ll capture some traffic from the mobile device.
I use tcpdump to capture the mobile device’s network requests. There are other tools you can use including Wireshark (formerly Ethereal). The tcpdump command is:
sudo tcpdump -i <iface> -n -s 0 -w <outfile> tcp or port 53
This generates a packet capture (pcap) file. You can specify any filename you want as the output file. I typically include the website I’m testing, the device I’m using, and the .pcap file extension, for example, “amazon-nexus.pcap”. Getting the correct interface is trickier. Run ifconfig -a again. For me the interface always starts with “en”, for example, “en1”. Look for an “en” interface that changed from “wifi hotspot” step 0 and now. For me it’s “en0”. I’m going to analyze https://stevesouders.com/ from my iPhone so I run this command in a shell:
sudo tcpdump -i en0 -n -s 0 -w souders-iphone.pcap tcp or port 53
Now I go to my iPhone (already connected to the “ss-laptop” wifi hotspot) and navigate to the page I want to analyze: https://stevesouders.com/. (If you’ve previously visited the page-to-be-analyzed then you might want to first clear your cache.) When it’s done loading I hit control-C to stop tcpdump. The souders-iphone.pcap file should be 300K+.
Protip: I create a BASH function to wrap the tcpdump command:
tcptrace ()
{
    if [ "" = "$1" ]; then
        declare outfile="aaa.pcap";
        echo "Using 'aaa.pcap' as the output file.";
    else
        declare outfile="$1";
    fi;
    if [ "" = "$2" ]; then
        declare iface="en1";
        echo "Using 'en1' as the interface.";
    else
        declare iface="$2";
    fi;
    sudo tcpdump -i $iface -n -s 0 -w $outfile tcp or port 53
}
With this function starting tcpdump is much simpler: tcptrace souders-iphone.pcap en0.
3: pcapperf
I use pcapperf to convert the pcap file to a HAR file and view it as a waterfall chart. pcapperf is an open source project from Bryan McQuade and Libo Song, both from Google. It’s very straightforward – simply upload the pcap file and you’ll see the waterfall chart.
Behind the curtains pcapperf uses the pcap2har project to convert the pcap file to a HAR file. HAR is a file format created by Jan Odvarko, Simon Perkins, and myself in 2009. It has become the industry standard for capturing web page loading information. It’s supported by Firebug, HttpWarch, IE 9+, Chrome, ShowSlow, WebPagetest, Fiddler, dynaTrace, Charles, and 20+ more. Jan (Honza) wrote the initial specification, and now there’s a draft W3C HAR spec. So once you have a HAR file you can use that in many other tools. For example, my HAR to PageSpeed tool generates a PageSpeed report from a HAR file enabling us to get a full PageSpeed analysis on our mobile pages.
4: USB wireless adapter
The steps so far work for most mobile developers who want to see waterfall charts – most people have a laptop that can run a wifi hotspot while connected to the Internet over Ethernet. For me, however, this wasn’t enough. I often don’t have an Ethernet connection. In fact, my laptop uses wifi 90%+ of the time. I especially want to capture mobile waterfalls during presentations where there often isn’t a LAN connection. But my MacBook Air, like most laptops, only has one wireless card. So I can’t be connected to wifi AND run a wifi hotspot. I used to get around this by carrying around a wireless router in my laptop bag – isn’t that convenient! You can see how I literally danced getting that to work during a tech talk at LinkedIn.
Now I have a better solution: I use a USB wireless adapter. It was hard to find one that worked on Mac OS. I settled on the netis WF-2111 150Mbps for ~$10. It comes with a Windows CD with the drivers, so I just downloaded them from the product page. When I plug the netis wireless adapter into my USB port the associated Wireless Network Utility starts up. I simply choose my normal wifi network from the Available Networks. Now I can remove my Ethernet cord and everything still works.
5: portable mobile hotspot
At this point we can generate mobile waterfall charts from any device even in the absence of an Ethernet connection. The main downside is it’s using a wifi connection – not a mobile carrier network. We can get a step closer to a true mobile experience by connecting the laptop to a portable hotspot running on a second mobile device. I do this on my Galaxy Nexus by going to Settings -> Wireless & Networks More… -> Tethering & portable hotspot -> Set up Wi-Fi hotspot. I use “ss-nexus” as the Network SSID, create a password, and Save. Clicking Portable Wi-Fi hotspot turns it on.
Returning to the Wireless Network Utility on my laptop I connect the netis USB wireless adapter to “ss-nexus”. I might have to re-connect the first mobile device (my iPhone in this case) to “ss-laptop” since it might have dropped that connection when the laptop switched to “ss-nexus”. The setup at this point is:
- The mobile device I’m testing (my iPhone) is connected to “ss-laptop” – the wifi hotspot running on my MacBook Air.
- My MacBook Air is using the netis USB wireless adapter to connect to “ss-nexus” – the portable hotspot on my Galaxy Nexus.
- My Galaxy Nexus is connected to the Internet via its mobile carrier network (T-Mobile).
With this setup I can capture a waterfall chart from any mobile device with all the traffic going over a mobile carrier network. Here’s the waterfall for https://stevesouders.com/ on my iPhone going over T-Mobile:
This is a lot of steps and is likely more complex than using a remote debugger. But I like that it’s one setup that works for all mobile devices, even devices that don’t have a remote debugger. What I’d really like is to have a waterfall chart capturing feature built into mobile browsers directly. This could be viewable on the mobile device, but could very easily be a HAR file that could be uploaded, viewed, and analyzed in the many tools that support HAR. Until then, I’ll just keep my tiny USB wireless adapter handy – that’s a lot easier than carrying a wireless router everywhere I go.
HTTP Archive: jQuery
A recent thread on Github for html5-boilerplate discusses whether there’s a benefit from loading jQuery from Google Hosted Libraries, as opposed to serving it from your local server. They referenced the great article Caching and the Google AJAX Libraries by Steve Webster.
Steve(W)’s article concludes by saying that loading jQuery from Google Hosted Libraries is probably NOT a good idea because of the low percentage of sites that use a single version. Instead, developers should bundle jQuery with their own scripts and host it from their own web server. Steve got his data from the HTTP Archive – a project that I run. His article was written in November 2011 so I wanted to update the numbers in this post to help the folks on that Github thread. I also raise some issues that arise from creating combined scripts, especially ones that result in sizes greater than jQuery.
Preamble
SteveW shows the SQL he used. I’m going to do the same. As background, when SteveW did his analysis in November 2011 there were only ~30,000 URLs that were analyzed in each HTTP Archive crawl. We’re currently analyzing ~300,000 per crawl. So this is a bigger and different sample set. I’m going to be looking at the HTTP Archive crawl for Mar 1 2013 which contains 292,297 distinct URLs. The SQL shown in this blog post references these pages based on their unique pageids: pageid >=Â 6726015 and pageid <= 7043218, so you’ll see that in the queries below.
Sites Loading jQuery from Google Hosted Libraries
The first stat in SteveW’s article is the percentage of sites using the core jQuery module from Google Hosted Libraries. Here’s the updated query and results:
mysql> select count(distinct(pageid)) as count,
(100*count(distinct(pageid))/292297) as percent
from requests where pageid >= 6726015 and pageid <= 7043218
and url like "%://ajax.googleapis.com/ajax/libs/jquery/%";
+-------+---------+
| count | percent |
+-------+---------+
| 53414 | 18.2739 |
+-------+---------+
18% of the world’s top 300K URLs load jQuery from Google Hosted Libraries, up from 13% in November 2011.
As I mentioned, the sample size is much different across these two dates: ~30K vs ~300K. To do more of an apples-to-apples comparison I restricted the Mar 1 2013 query to just the top 30K URLs (which is 28,980 unique URLs after errors, etc.):
mysql> select count(distinct(p.pageid)) as count,
(100*count(distinct(p.pageid))/28980) as percent
from requests as r, pages as p where p.pageid >= 6726015 and p.pageid <= 7043218
and rank <= 30000 and p.pageid=r.pageid
and r.url LIKE "%://ajax.googleapis.com/ajax/libs/jquery/%";
+-------+---------+
| count | percent |
+-------+---------+
|  5517 | 19.0373 |
+-------+---------+
This shows an even higher percentage of sites loading jQuery core from Google Hosted Libraries: 19% vs 13% in November 2011.
Most Popular Version of jQuery from Google Hosted Libraries
The main question being asked is: Is there enough critical mass from jQuery on Google Hosted Libraries to get a performance boost? The performance boost would come from cross-site caching: The user goes to site A which deposits jQuery version X.Y.Z into the browser cache. When the user goes to another site that needs jQuery X.Y.Z it’s already in the cache and the site loads more quickly. The probability of cross-site caching is greater if sites use the same version of jQuery, and is lower if there’s a large amount of version fragmentation. Here’s a look at the top 10 versions of jQuery loaded from Google Hosted Libraries (GHL) in the Mar 1 2013 crawl.
mysql> select url, count(distinct(pageid)) as count,
(100*count(distinct(pageid))/292297) as percent
from requests where pageid >= 6726015 and pageid <= 7043218
and url LIKE "%://ajax.googleapis.com/ajax/libs/jquery/%"
group by url order by count desc;
| Table 1. Top Versions of jQuery from GHL Mar 1 2013 | |
| jQuery version | percentage of sites |
|---|---|
| 1.4.2 (http) | 1.7% |
| 1.7.2 (http) | 1.6% |
| 1.7.1 (http) | 1.6% |
| 1.3.2 (http) | 1.2% |
| 1.7.2 (https) | 1.1% |
| 1.8.3 (http) | 1.0% |
| 1.7.1 (https) | 0.8% |
| 1.8.2 (http) | 0.7% |
| 1.6.1 (http) | 0.6% |
| 1.5.2 (http) 1.6.2 (http) |
0.5% (tied) |
That looks highly fragmented. SteveW saw less fragmentation in Nov 2011:
| Table 2. Top Versions of jQuery from GHL Nov 15 2011 | |
| jQuery version | percentage of sites |
|---|---|
| 1.4.2 (http) | 2.7% |
| 1.3.2 (http) | 1.3% |
| 1.6.2 (http) | 0.8% |
| 1.4.4 (http) | 0.8% |
| 1.6.1 (http) | 0.7% |
| 1.5.2 (http) | 0.7% |
| 1.6.4 (http) | 0.5% |
| 1.5.1 (http) | 0.5% |
| 1.4 (http) | 0.4% |
| 1.4.2 (https) | 0.4% |
Takeaways #1
Here are my takeaways from looking at jQuery served from Google Hosted Libraries compared to November 2011:
- The most popular version of jQuery is 1.4.2 in both analyses. Even though the percentage dropped from 2.7% to 1.7%, it’s surprising that such an old version maintained the #1 spot. jQuery 1.4.2, was released February 19, 2010 – over three years ago! The latest version, jQuery 1.9.1, doesn’t make it in the top 10 most popular versions, but it was only released on February 4, 2013. The newest version in the top 10 is jQuery 1.8.3, which is used on 1% of sites (6th most popular). It was released November 13, 2012. The upgrade rate on jQuery is slow, with many sites using versions that are multiple years old.
- There is less critical mass on a single version of jQuery compared to November 2011: 2.7% vs. 1.7%. If your site uses the most popular version of jQuery the probability of users benefiting from cross-site caching is lower today than it was in November 2011.
- There is more critical mass across the top 10 versions of jQuery. The top 10 versions of jQuery accounted for 8.8% of sites in November 2011, but has increased to 10.8% today.
- 8% of sites loading jQuery from Google Hosted Libraries add a query string to the URL. The most popular URL with a querystring is
/ajax/libs/jquery/1.4.2/jquery.min.js?ver=1.4.2. (While that’s not surprizing, the second most popular URL is:/ajax/libs/jquery/1.7.1/jquery.min.js?ver=3.5.1.) As SteveW pointed out, this greatly reduces the probability of benefiting from cross-site caching because the browser uses the entire URL as the key when looking up files in the cache. Sites should drop the querystring when loading jQuery from Google Hosted Libraries (or any server for that matter).
The Main Question
While these stats are interesting, they don’t answer the original question asked in the Github thread: Which is better for performance: Loading jQuery from Google Hosted Libraries or from your own server?
There are really three alternatives to consider:
- Load core jQuery from Google Hosted Libraries.
- Load core jQuery from your own server.
- Load core jQuery bundled with your other scripts from your own server.
I don’t have statistics for #3 in the HTTP Archive because I’m searching for URLs that match some regex containing “jquery” and it’s unlikely that a website’s combined script would preserve that naming convention.
I can find statistics for #2. This tells us the number of sites that could potentially contribute to the critical mass for cross-site caching benefits if they switched from self-hosting to loading from Google Hosted Libraries. Finding sites that host their own version of jQuery is difficult. I want to restrict it to sites loading core jQuery (since that’s what they would switch to on Google Hosted Libraries). After some trial-and-error I came up with this long query. It basically looks for a URL containing “jquery.[min.].js”, “jquery-1.x[.y][.min].js”, or “jquery-latest[.min].js”.
select count(distinct(pageid)) as count,
(100*count(distinct(pageid))/292297) as percent
from requests where pageid >= 6726015 and pageid <= 7043218
and ( url like "%/jquery.js%" or url like "%/jquery.min.js%"
or url like "%/jquery-1._._.js%" or url like "%/jquery-1._._.min.js%"
or url like "%/jquery-1._.js%" or url like "%/jquery-1._.min.js%"
or url like "%/jquery-latest.js%" or url like "%/jquery-latest.min.js%" )
and mimeType like "%script%";
+--------+---------+
| count  | percent |
+--------+---------+
| 164161 | 56.1624 |
+--------+---------+
Here are the most popular hostnames across all sites:
| Table 3. Top Hostnames Serving jQuery Mar 1 2013 | |
| hostname | percentage of sites |
|---|---|
| ajax.googleapis.com | 18.3% |
| code.jquery.com | 1.4% |
| yandex.st | 0.3% |
| ajax.aspnetcdn.com | 0.2% |
| mat1.gtimg.com | 0.2% |
| ak2.imgaft.com | 0.1% |
| img1.imgsmail.ru | 0.1% |
| www.yfum.com | 0.1% |
| img.sedoparking.com | 0.1% |
| www.biggerclicks.com | 0.1% |
Takeaways #2
- 56% of sites are using core jQuery. This is very impressive. This is similar to the findings from BuiltWith (compared to “Top 100,000” trends). The percentage of sites using some portion of jQuery is even higher if you take into consideration jQuery modules other than core, and websites that bundle jQuery with their own scripts and rename the resulting URL.
- 38% of sites are loading core jQuery from something other than Google Hosted Libraries (56% – 18%). Thus, there would be a much greater potential to benefit from cross-site caching if these websites moved to Google Hosted Libraries. Keep in mind – this query is just for core jQuery – so these websites are already loading that module as a separate resource meaning it would be easy to switch that request to another server.
- Although the tail is long, Google Hosted Libraries is by far the most used source for core jQuery. If we want to increase the critical mass around requesting jQuery, Google Hosted Libraries is the clear choice.
Conclusion
This blog post contains many statistics that are useful in deciding whether to load jQuery from Google Hosted Libraries. The pros of requesting jQuery core from Google Hosted Libraries are:
- potential benefit of cross-site caching
- ease of switching if you’re already loading jQuery core as a standalone request
- no hosting, storage, bandwidth, nor maintenance costs
- benefit of Google’s CDN performance
- 1-year cache time
The cons to loading jQuery from Google Hosted Libraries include:
- an extra DNS lookup
- you might use a different CDN that’s faster
- can’t combine jQuery with your other scripts
There are two other more complex but potentially significant issues to think about if you’re considering bundling jQuery with your other scripts. (Thanks to Ilya Grigorik for mentioning these.)
First, combining multiple scripts together increases the likelihood of the resource needing to be updated. This is especially true with regard to bundling with jQuery since jQuery is likely to change less than your site-specific JavaScript.
Second, unlike an HTML document, a script is not parsed incrementally. That’s why some folks, like Gmail, load their JavaScript in an iframe segmented into multiple inline script blocks thus allowing the JavaScript engine to parse and execute the initial blocks while the file is still being downloaded. Combining scripts into a single, large script might reach the point where delayed parsing would be offset by downloading two or more scripts. As far as I know this has not been investigated enough to determine how “large” the script must be to reach the point of negative returns.
If you’re loading core jQuery as a standalone request from your own server (which 38% of sites are doing), you’ll probably get an easy performance boost by switching to Google Hosted Libraries. If you’re considering creating a combined script that includes jQuery, the issues raised here may mean that’s not the optimal solution.
SteveW and I both agree:Â To make the best decision, website owners need to test the alternatives. Using a RUM solution like Google Analytics Site Speed, Soasta mPulse, Torbit Insight, or New Relic RUMÂ will tell you the impact on your real users.
Zopflinator
Last week Google open sourced Zopfli – a new data compression library based on Deflate (and therefore a drop-in replacement for Deflate without requiring any changes to the browser). The post mentioned that the “output generated by Zopfli is typically 3–8% smaller compared to zlib” but Zopfli takes longer to compress files – “2 to 3 orders of magnitude more than zlib at maximum quality”. 2 to 3 orders of magnitude longer! When I read that I was thinking Zopfli might take seconds or perhaps minutes to compress a 500K script.
Also, even after reading the detailed PDF of results it still wasn’t clear to me how Zopfli would perform on typical web content. The PDF mentioned four corpora. One was called “Alexa-top-10k” which is cool – that’s real web stuff. But was it just the HTML for those sites? Or did it also include scripts and stylesheets? And did it go too far and include images and Flash? I clicked on the link in the footnotes to get more info and was amused when it opened a list of URLs from my HTTP Archive project! That was gratifying but didn’t clarify which responses were analyzed from that list of sites.
The Canterbury Corpus was also listed. Seriously?! Isn’t Chaucer too old to be relevant to new compression algorithms? Turns out it’s not based on Canterbury Tales. (Am I the only one who jumped to that conclusion?) Instead, it’s a standard set of various types of files but most of them aren’t representative of content on the Web.
Finally, it mentioned “zlib at maximum quality”. AFAIK most sites run the default compression built into the server, for example mod_deflate for Apache. While it’s possible to change the compression level, I assume most site owners go with the default. (That would be an interesting and easy question to answer.) I had no idea how “zlib at maximum quality” compared to default web server compression.
My thirst for Zopfli information went unquenched. I wanted a better idea of how Zopfli performed on typical web resources in comparison to default server compression settings, and how long it took.
Luckily, before I got off Twitter Ilya pointed to some Zopfli installation instructions from François Beaufort. That’s all I needed to spend the rest of the morning building a tool that I and anyone else can use to see how Zopfli performs:
It’s easy to use. Just enter the URL to a web resource and submit. Here’s an example for jQuery 1.9.1 served from Google Hosted Libraries.

Notes:
- The form doesn’t accept URLs for HTML, images, and Flash. I added HTML to that list because Zopfli makes the most sense for static resources due to the longer compression times.
- By default the results are recorded in my DB and shown lower in the page. It’s anonymous – no IPs, User-Agent strings, etc. are saved – just the URL, content-type, and compression results. But sometimes people want to test URLs for stealth sites – so that’s a good reason to UNcheck the crowdsource checkbox.
- Four file sizes are shown. (The percentages are based on comparison to the uncompressed file.)
- Uncompressed file size is the size of the content without any compression.
- mod_deflate size is based on serving the content through my Apache server using mod_deflate’s default settings.
- The gzip -9 size is based on running that from the commandline on the uncompressed content.
- Zopfli results are also based on running the Zopfli install from the commandline.
- Folks who don’t want to install Zopfli can download the resultant file.
The results in this example are pretty typical – Zopfli is usually 1% lower than gzip -9, and gzip -9 is usually 1% lower than mod_deflate. 1% doesn’t seem like that much, but remember that 1% is relative to the original uncompressed response. The more relevant comparison is between Zopfli and mod_deflate. About 70% of compressible responses are actually compressed (across the world’s top 300K websites). The primary question is how much less data would be transferred if responses were instead compressed with Zopfli?
One day after being launched, 238 URLs have been run through Zopflinator. The average sizes are:
- uncompressed: 106,272 bytes
- mod_deflate: 28,732 bytes (27%)
- gzip -9: 28,062 bytes (26%)
- Zopfli: 27,033 bytes (25%)
The average Zopfli savings over mod_deflate is 1,699 bytes (5.9%). This is pretty significant savings. Just imagine if all script and stylesheet transfer sizes were reduced by 6% – that would reduce the number of roundtrips as well as reducing mobile data usage.
Previously I mentioned that Zopfli has compression times that are “2 to 3 orders of magnitude more than zlib at maximum quality”. When running Zopfli from the commandline it seemed instantaneous – so my fears of it taking seconds or perhaps minutes were unfounded. Of course, this is based on my perception – the actual CPU time consumed by the web server at scale could be significant. That’s why it’s suggested that Zopfli might be best suited for static content. A great example is Google Hosted Libraries.
Of course, anyone using Zopfli out-of-band has to configure their server to use these pre-generated files for compressed responses. So far I haven’t seen examples of how to do this. Ilya pointed out that AWS and Google Cloud Storage work this way already – where you have to upload uncompressed as well as compressed versions of web resources. Zopfli fits well if you use those services. For people who currently do compression on the fly (e.g., using mod_deflate) the change to use Zopfli is likely to outweigh the benefits as long as Zopfli can’t be run in realtime.
I hope to see adoption of Zopfli where it makes sense. If you use Zopfli to compress your resources, please add a comment with feedback on your experience.